North star metric: how to choose one that drives growth
What a north star metric is, the tests a good one passes, the input metrics that move it, examples by business model and the mistakes that make it useless.


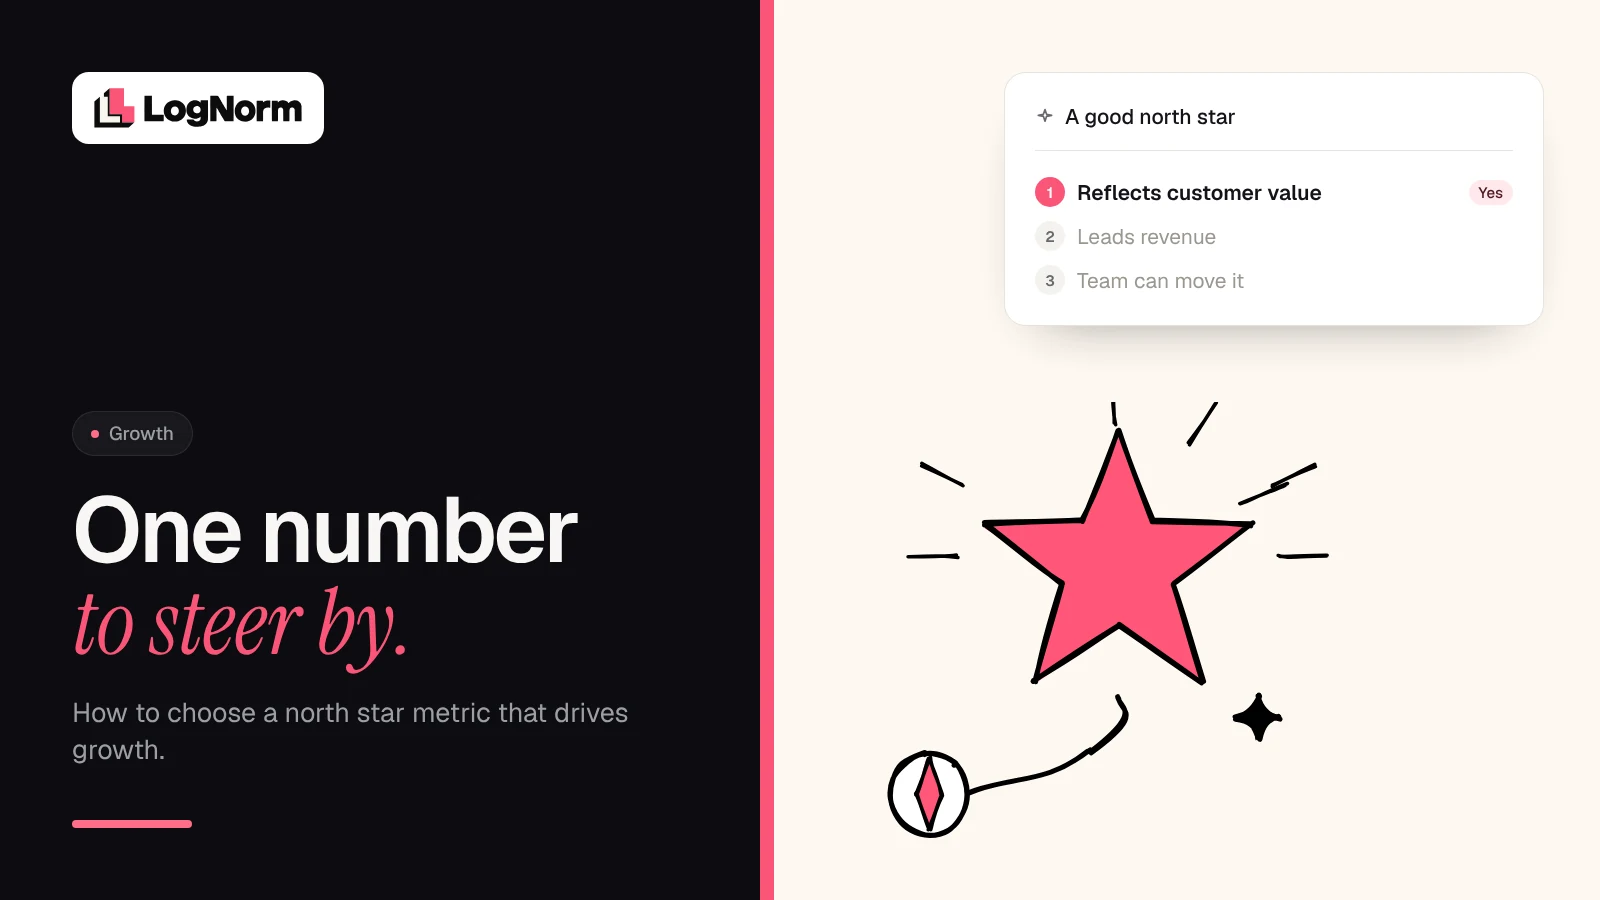
A north star metric is the single number that best captures the value customers get from your product, and that predicts long-term revenue. Growth lead Sean Ellis defines it as "the single metric that best captures the core value that your product delivers to customers." Airbnb's is nights booked. Yours should be the number that rises when customers succeed, and that your team can move through a small set of input metrics.
Most startups track dozens of numbers and agree on none of them. A north star metric gives every team the same answer to one question: did customers get more value from us this week? It sits at the top of the measurement stack in our growth marketing playbook for startups.
What is a north star metric?
A north star metric (NSM) is one count, rate or ratio that represents the value your product creates for customers and leads your revenue rather than trailing it.
Two primary sources are worth reading:
- Sean Ellis, who led early growth at Dropbox and later founded GrowthHackers, gave the definition quoted above in a 2017 GrowthHackers post, with Airbnb's nights booked as the example because it captures value for both guests and hosts. In a 2018 interview he put it more simply: "The North Star Metric is really trying to quantify that value over time" (Intercom).
- Amplitude's North Star Playbook turned the idea into a working framework. It describes the metric as "a single critical rate, count, or ratio that represents your product strategy," and says it is defined by three core qualities: it represents the value users get from your product, it is within product and marketing's sphere of influence, and it is a leading indicator of revenue (Amplitude, The North Star Playbook).
So the meaning of a north star metric comes down to three words: value, influence, leading. If a number misses any one of them, it is a KPI, not a north star.
North star metric vs KPIs and "one metric that matters"
A north star does not replace your other metrics. It sits above them.
| Metric type | What it answers | How long it lasts | Example |
|---|---|---|---|
| North star metric | Are customers getting more value over time? | Quarters to years | Nights booked |
| Input metric | Which lever is moving the north star? | Quarters | New guests making a first booking |
| "One metric that matters" | What is the bottleneck right now? | Weeks to a quarter | Signup-to-first-use rate |
| Business result | Is the company healthy? | Reported monthly | Revenue, margin, cash |
Ellis draws the same line between the north star and the "one metric that matters": "The North Star Metric is a persistent overall success metric, and if you want to drive the North Star Metric, there might be a 'one metric that matters' right now, more than any other" (Intercom).
What makes a good north star metric
A good north star passes four tests: it reflects customer value, it leads revenue, it is measurable, and your team can influence it. Amplitude's playbook expands these into a seven-question checklist: does it express customer value, represent your vision and strategy, act as a leading indicator, stay actionable, make sense to non-technical partners, stay measurable, and avoid being a vanity metric (Amplitude).
- It reflects customer value. The number should only go up when a customer gets something they wanted: a booking, a shipped report, a task done. Amplitude singles out "Daily Active Users" and "Registered Users" as weak choices because "they say nothing about what your customers value."
- It leads revenue. It should move before revenue does. Amplitude suggests subscription businesses find the behaviours that correlate with renewal and build the north star around those.
- It is measurable. You need to track it reliably. If you cannot instrument the outcome, pick a completed action that signals it.
- Your team can influence it. It should not mostly reflect market trends. The playbook's example: an HR app should not track "Customers' Lifelong Employees", since the labour market moves that number more than the product does.
Input metrics: the levers your team actually pulls
Input metrics are the few factors that produce your north star. Amplitude describes them as "a small set of influential, complementary factors that you believe most directly affect your North Star Metric." Teams work on inputs. The north star is the result.
The playbook's grocery delivery example shows the structure. If the north star is total monthly items received on time, four inputs could drive it: customers placing lots of orders, orders with lots of items, fulfilling lots of orders, and delivering orders on time.
John Cutler, co-author of the playbook, puts the principle bluntly: "If you can move your North Star directly, it's probably not a good North Star." The metric should sit one level out of reach, so teams ask why it went up or down and trace the answer back to an input.
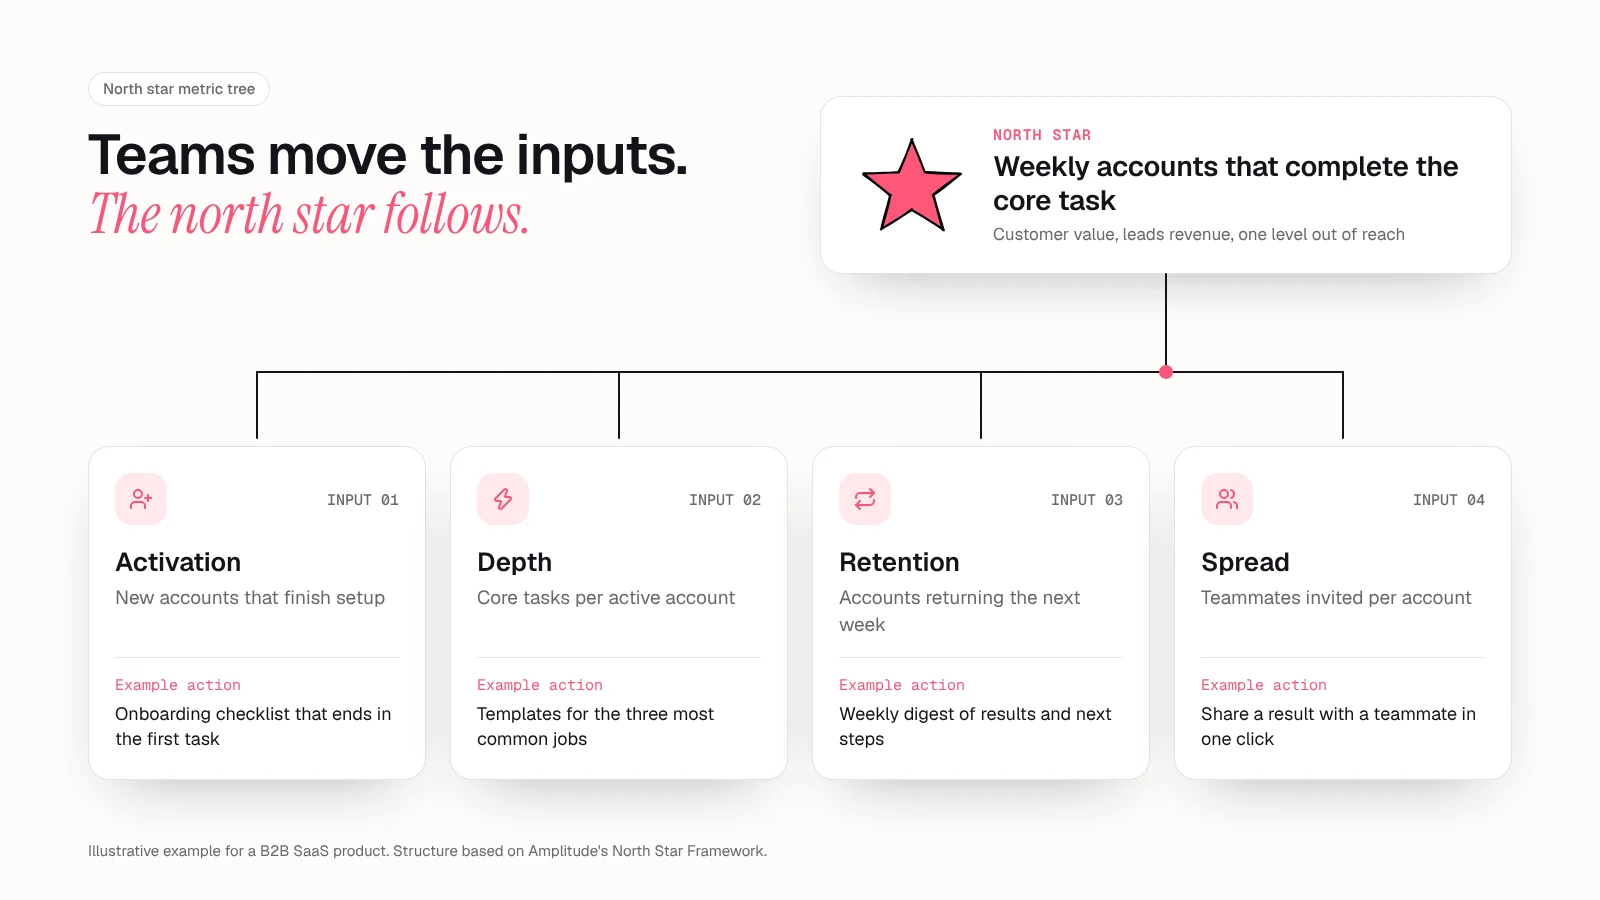
A good set of inputs usually covers the whole customer journey:
- Breadth: how many customers reach first value (activation).
- Depth: how much value each active customer gets (frequency, items, tasks).
- Retention: how many come back in the next period.
- Spread: how many new customers arrive through existing ones (invites, shares, referrals).
The spread input is where your growth loops live: one customer's use of the product brings in the next, and growth compounds.
Burger King's digital team used this structure. It chose "digital transactions per user" as its north star, with three inputs: new user activation, registration and frequency. One squad prioritised mobile order coupons specifically to drive frequency (Amplitude).
North star metric examples
Examples are only useful when someone who set or documented them is the source. Here are those, then illustrative examples by business model.
Company examples with a source
| Company | North star metric | Source |
|---|---|---|
| Airbnb | Nights booked | Sean Ellis |
| Daily active users | Sean Ellis | |
| LogMeIn | Remote control sessions | Sean Ellis (his own team) |
| Netflix (2005, DVD era) | Percentage of customers placing three or more DVDs in their queue during their first session | Amplitude playbook |
| Burger King (digital) | Digital transactions per user | Amplitude playbook |
| Amplitude (at one point) | Weekly Learning Users: active users who shared a learning consumed by at least two other people in the previous seven days | Amplitude playbook |
Two lessons stand out. First, the sources disagree on daily active users. Ellis calls it "an easier proxy for value" at Facebook, while Amplitude lists DAU as a vanity metric. The difference is the product: for a social network, presence is close to value; for most B2B tools, it is not.
Second, the LogMeIn story shows why inputs matter. Ellis says 95% of new signups never had a single remote control session. Engineering, product and marketing focused on the signup-to-usage rate, improved it by 1,000%, and "if users had a great first experience, retention improved a ton. Revenue improved a ton. Referral improved a ton" (Intercom).
Illustrative examples by business model
These are illustrations, not real companies. Amplitude's framing helps: decide whether you play an attention game (time spent shows satisfaction), a transaction game (customers find and buy the right thing) or a productivity game (customers have a job to do).
| Business model | Illustrative north star | Why it passes | Weak alternative |
|---|---|---|---|
| B2B SaaS (productivity) | Weekly accounts that complete the core workflow | Completion is the value, and it predicts renewal | Seats sold |
| Marketplace (transaction) | Successful transactions per week, with no dispute | Value for both buyer and seller in one count | Listings created |
| Content site (attention) | Weekly returning readers who finish an article | Returning and finishing signal real reading | Page views |
| Ecommerce (transaction) | Orders delivered that are not returned | Captures a happy outcome, not just a click | Sessions |
| Developer tool or API | Weekly active projects making successful calls | Usage in production means the tool is doing its job | Signups |
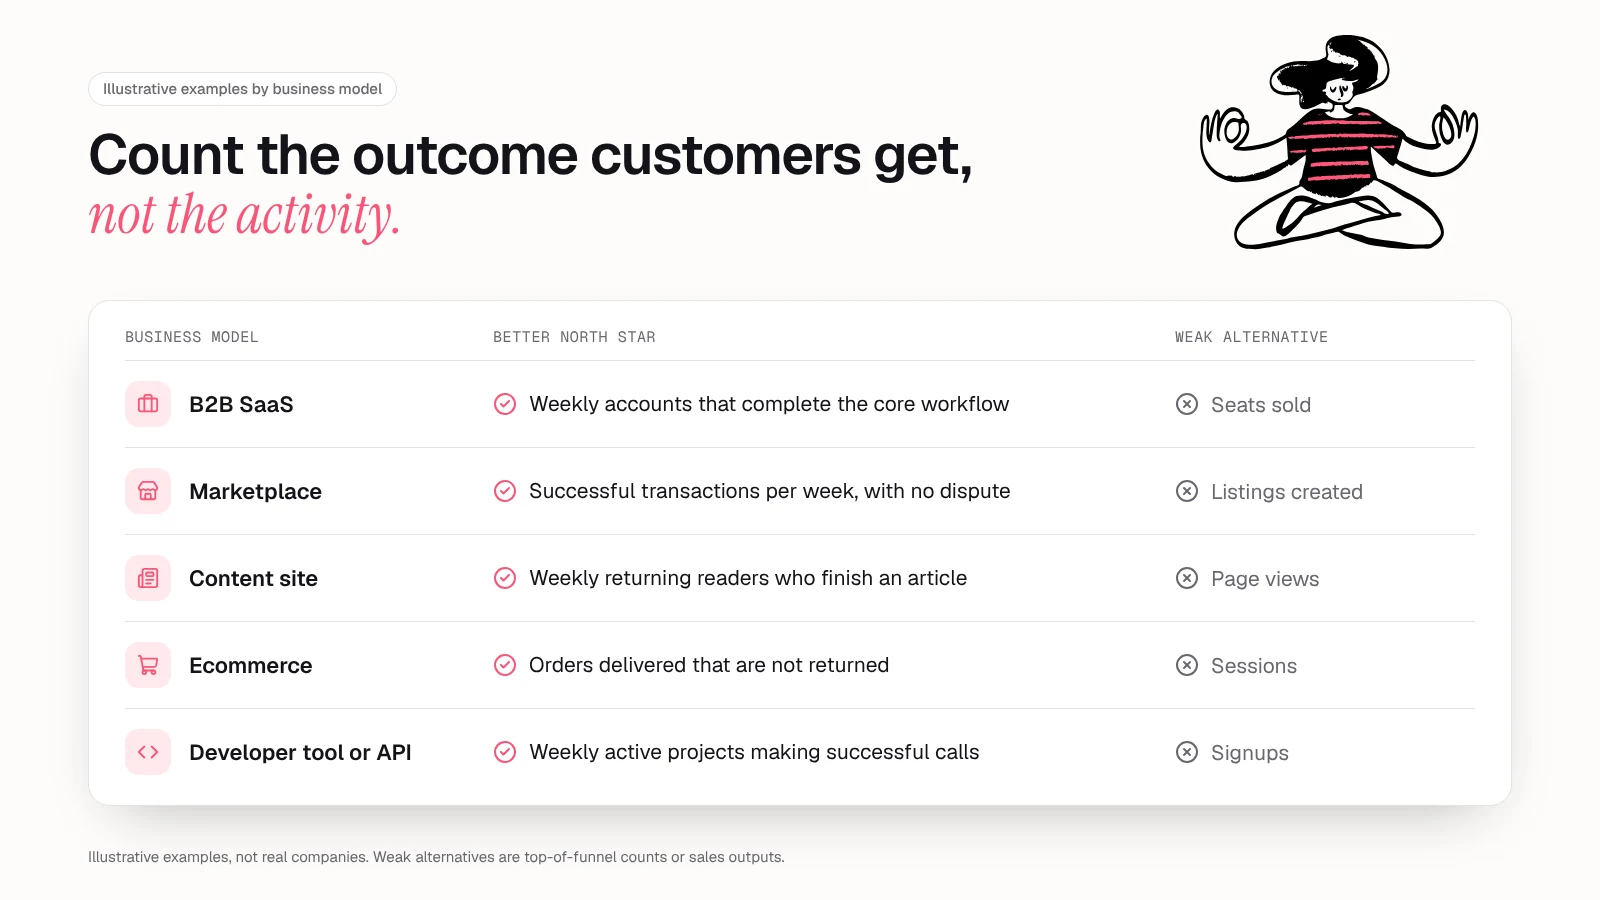
Every weak alternative is a top-of-funnel count or a sales output. Those numbers belong in your acquisition reporting, next to customer acquisition cost, not at the top of the company.
How AI products might define value
AI products make this harder, because usage and value come apart. A user can send fifty prompts and keep nothing, or send three and finish a week of work. A north star built on raw activity (messages, tokens, sessions) rises when the model is confusing as easily as when it is useful. A better starting point is an accepted outcome: the output the user kept, shipped or acted on.
Illustrative options, by type of AI product:
- AI writing or content tool: drafts published or exported per week.
- Coding assistant: suggestions accepted and kept in the codebase.
- AI support agent: conversations resolved without a human handoff and without a repeat contact.
- AI agent that runs tasks: tasks completed that the user did not undo or redo.
The pattern is "completed and kept." Pair it with a quality guardrail, such as the share of outputs reversed, so the team cannot grow the number with more low-quality output.
Common north star metric mistakes
Most north stars fail for one of five reasons.
- Using revenue as the north star. Revenue trails behaviour. Amplitude names "Monthly Recurring Revenue" and "Average Revenue per User" as poor choices because "they tell you what happened in the past rather than predicting future results." Keep revenue as the business result your north star should predict.
- Choosing a vanity metric. Amplitude's list of example vanity metrics: daily active users, ad impressions, number of downloads, page views, registered users, story points delivered and time on page. Each can rise while customers get no more value.
- Having too many. A dashboard of eight "north stars" is a dashboard. The playbook recommends a single north star metric and its inputs per product, and notes it is unlikely one product leader should manage more than one.
- Trying to move it directly. If one campaign or one feature flag can spike the number, it is an input or a vanity metric. The work should move inputs, and the north star should follow.
- Never changing it. Your north star reflects your strategy. When the strategy shifts, the metric should too. Amplitude changed its own north star to measure collaboration when it moved from individual analysts to teams.
How to roll out and review a north star metric
Choosing the metric takes a workshop. Making it useful takes a weekly habit.
- Name the value. Write one sentence on what customers come to you to get done. Decide which game you are in: attention, transaction or productivity.
- Draft three to five candidates. Score each against the four tests above. Drop anything you can move directly.
- Check it against history. Did past customers who hit the candidate behaviour retain or expand more than those who did not? If not, keep looking.
- Map the inputs. Pick the few inputs that cover breadth, depth, retention and spread. Give each input an owner.
- Tie every piece of work to an input. Each experiment, feature or campaign names the input it should move, or it leaves the plan.
- Review weekly, revisit rarely. Look at the inputs every week and the north star every month. Revisit the north star itself when strategy, stage or market changes.
Step five is where most teams slip. The playbook lists force-ranked backlogs and structured reviews among the constraints that keep teams from "moving around" instead of doing true work. For acquisition inputs, tools like LogNorm turn site audits, Search Console, keyword and AI-answer signals into a ranked weekly backlog of Moves, and check results at 28 and 90 days, so each week's content and SEO work stays tied to the input it should move. The leading indicators in our guide to SEO KPIs can serve as inputs for the organic channel.
On reviews, Ted Clark, a senior customer success architect at Amplitude, gives the clearest rule: "If your North Star is flat, then expect your revenue to be flat. But if at any point your North Star isn't directionally indicating where your revenue is going, then it's time to revise it."
Once the north star is in place, the rest of your growth marketing system, from channels to experiments, has one number to serve.
FAQ
What is a north star metric in simple terms?
It is the one number that goes up when customers get more value from your product. It should predict future revenue and be something your team can influence. Airbnb's nights booked is the classic example.
What is the difference between a north star metric and a KPI?
A KPI is any key measure you track, and most companies track many. A north star metric is the single KPI that sits above the others because it captures customer value and leads revenue. Other KPIs either drive it, as inputs, or report business results.
Can revenue be a north star metric?
It is usually a poor choice. Revenue is a lagging indicator: it tells you what already happened, and it can rise through price increases while customer value falls. Treat it as the result your north star should predict.
How many north star metrics should a company have?
One per product, with a small set of input metrics underneath it. Large companies with separate products and customer bases may have one per product line. More than one per team usually means none of them guides decisions.
How often should you change your north star metric?
Rarely, and on purpose. Review it when your strategy, stage or market changes, or when it stops moving in the same direction as revenue. Changing it every quarter defeats its purpose, but keeping one that no longer fits your strategy is worse.