SEO KPIs that actually predict growth
Which SEO KPIs to track, where to find each in Search Console and GA4, how often to review them, and a one-page scorecard for pre-PMF and early-growth startups.


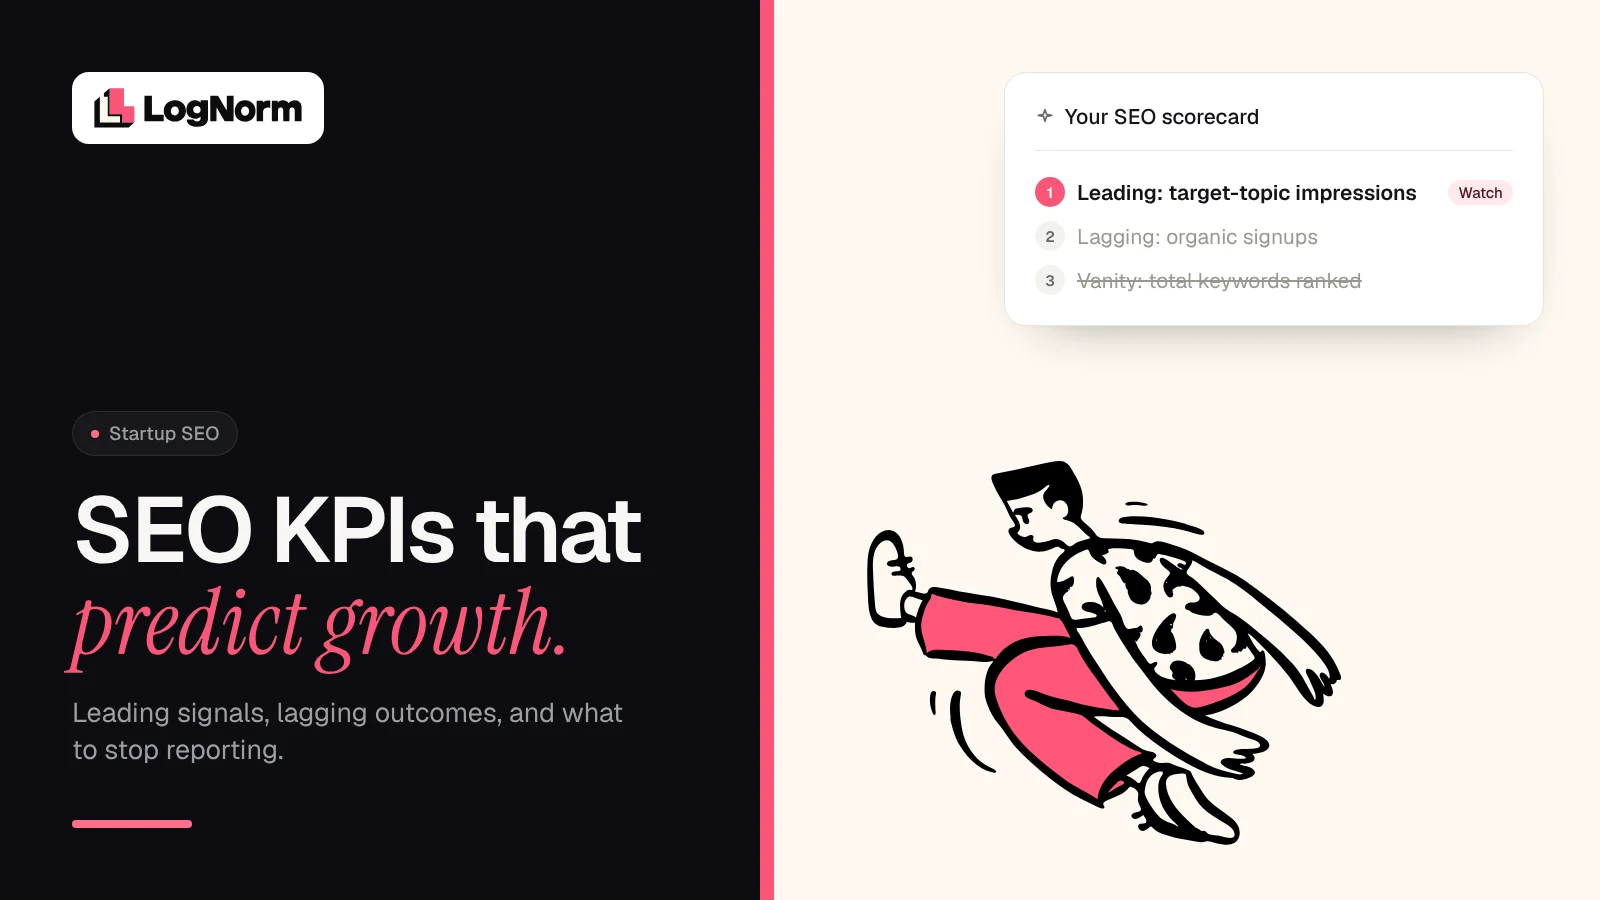
SEO KPIs are the few numbers that tell you whether search is turning into customers. The useful ones split into leading indicators (key pages indexed, impressions and average position on the topics you target, share of AI answers) and lagging outcomes (organic signups, pipeline and revenue). Track a handful of each, review them on a fixed cadence, and stop reporting the rest.
Most startup SEO reports do the opposite: every exportable number, and no answer to whether the work is on track. A good KPI set answers two questions. Is visibility building where it matters, and is it producing revenue?
This post is part of our SEO playbook for startups without an SEO hire. Here we focus on measurement: what each KPI tells you, where to get it, how often to look, and a one-page scorecard you can copy.
Why most SEO reports predict nothing
A report predicts growth only if its numbers move before revenue does. Most do not.
The first failure is mixing inputs and outcomes. A traffic increase sounds like progress, but it can come from one post ranking for a query your buyers never search, while comparison, use-case and pricing pages sit on page three unnoticed.
The second failure is time. Outcomes lag the work, so watching only signups means you learn about problems late, and watching only rankings means you never learn whether rankings pay. You need both, labelled clearly.
Leading, lagging and vanity: three buckets
Sort every SEO metric into one of three buckets before it goes in a report.
- Leading indicators move first and you can influence them directly. Indexing of key pages, impressions for your target topics, average position on your target clusters and your share of AI answers all respond to the work well before revenue does.
- Lagging outcomes prove the strategy worked. Organic signups, qualified pipeline and revenue from organic search arrive later and are what the business cares about.
- Vanity metrics look good in a slide but do not change a decision. Total keywords ranked, raw sessions and third-party authority scores belong here.
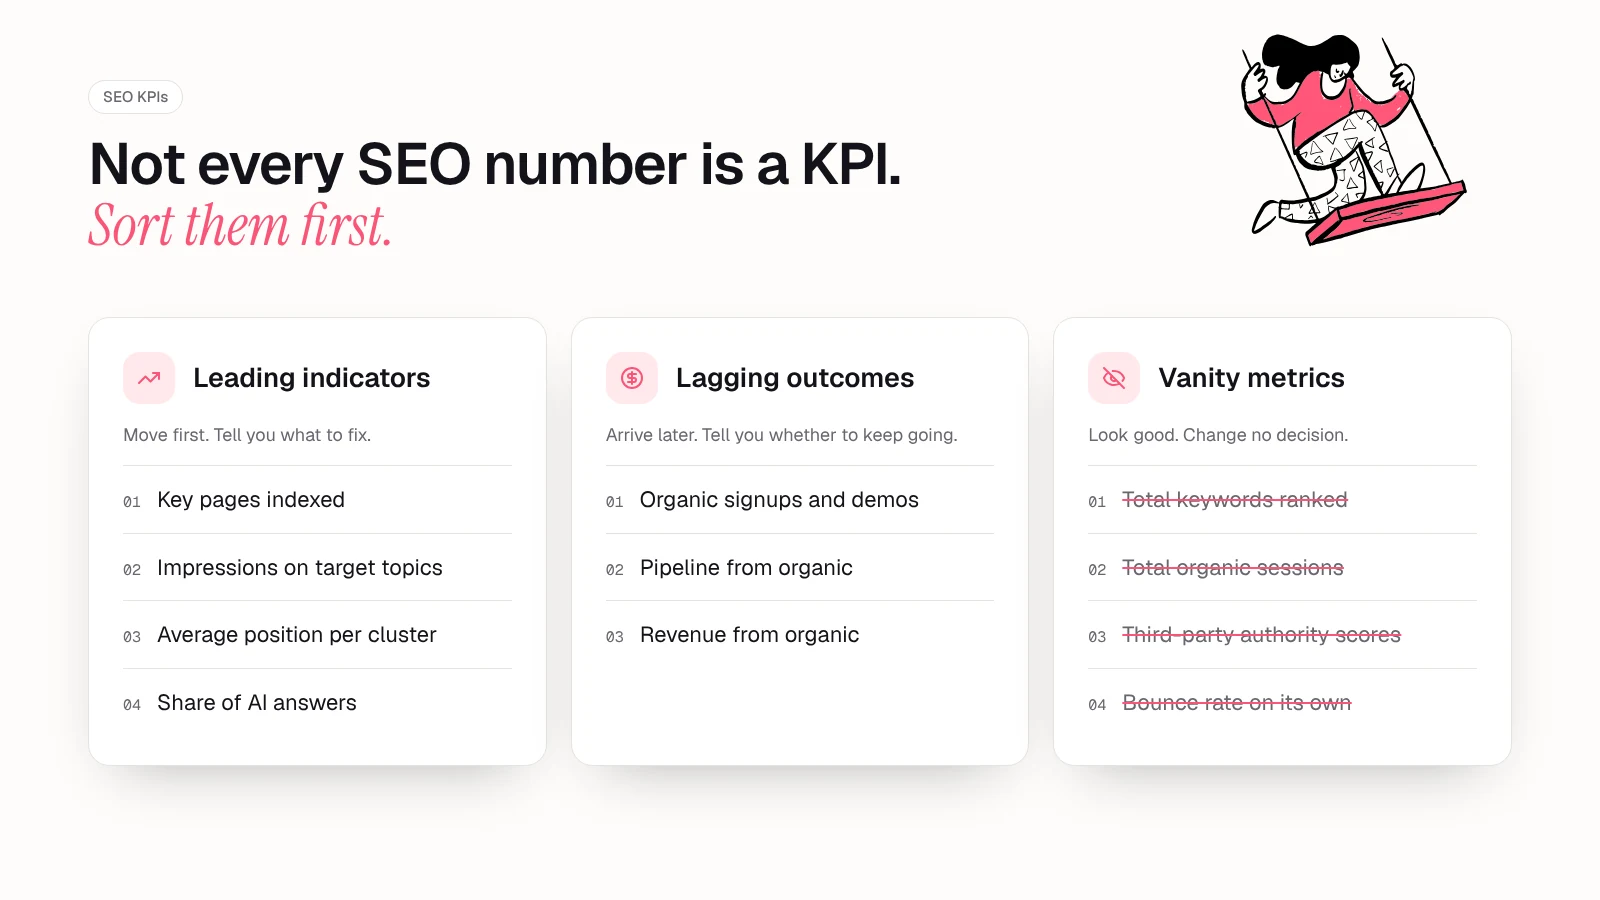
The rule of thumb: leading indicators tell you what to fix, lagging outcomes tell you whether to keep going, and vanity metrics tell you nothing you can act on.
Leading indicators to track
These four move first, so problems show up while they are still cheap to fix.
1. Key pages indexed
What it tells you: whether Google can show your important pages at all. A page that is not indexed cannot earn impressions, so this is the first gate.
Where to get it: the Page indexing report in Search Console shows how many of your URLs Google has indexed and groups the rest by reason, such as a noindex tag, a robots.txt block, a duplicate or a 404. Google is explicit that you should not chase a perfect number: "Don't expect every URL on your site to be indexed," the help page says, "Just be sure that the key pages on your site are indexed."
How to track it: do not report total indexed URLs. Keep a short list of the pages that matter (product, use cases, comparisons, pricing, your best guides) and report how many of those are indexed.
Cadence: check weekly while you are publishing often, then monthly.
2. Impressions for target topics
What it tells you: whether Google is starting to show you for the topics you chose. Impressions rise before clicks do, so this is your earliest signal that a content cluster is working.
Where to get it: the Search Console Performance report shows clicks, impressions, CTR and average position by query, page, country, device and date. Google defines an impression as "how often someone saw a link to your site on Google".
How to track it: filter by page path (for example, everything under one cluster's URLs) or by a query pattern that matches the topic. Then split branded from non-branded. Search Console has a branded queries filter, available to all eligible sites since March 2026 (top-level properties with enough query volume). Non-branded impressions are the number to watch: Google's own post says they show "how new users find your content without any initial intent to go to your site."
Sites with large query volume also get Query groups in Search Console Insights, which cluster similar queries and flag groups trending up or down.
Cadence: weekly glance, monthly review against the previous month.
3. Average position on target clusters
What it tells you: how close you are to the clicks on the queries you care about. Moving from page two to page one may not change traffic yet, but it predicts that traffic is coming.
Where to get it: the same Performance report. Average position is the topmost position your link held for each query, averaged across queries. Google calls it "approximately where on the page a given link was seen, relative to other results". Because it is an average, a site-wide figure can drop simply because you started appearing for many new, low-ranking queries, which is often good news.
How to track it: never report site-wide average position. Report it per cluster, filtered to the queries or pages in that cluster, and pair it with impressions so a falling average does not cause panic. If you are still choosing those clusters, our guide to building an SEO content strategy around topic clusters covers how to pick them.
Cadence: monthly. Weekly position changes are mostly noise.
4. Share of AI answers
What it tells you: whether ChatGPT, Perplexity, Gemini and Google's AI features name you when buyers ask about your category.
Where to get it: partly in your existing tools. Google counts links in AI Overviews and AI Mode under its standard click and impression rules, so they already sit inside your Search Console totals. In GA4, the default channel groups include an AI Assistant channel for visits "from sources like ChatGPT, Gemini, Deepseek, Copilot, or Grok", which excludes Google's AI Overviews and AI Mode.
Referral visits show clicks, not mentions. To measure share of answers, run a fixed set of buyer prompts on a schedule and record whether you appear and who appears instead. We cover the method in detail in how to measure AI visibility.
Cadence: monthly, with the same prompt set each time so results are comparable.
Lagging outcomes that prove it worked
Leading indicators earn you patience. Lagging outcomes decide whether the channel deserves more budget.
Organic signups and key events
What it tells you: whether search visitors take the action that matters, such as starting a trial, booking a demo or creating an account.
Where to get it: GA4. Mark the action as a key event, which Google defines as "an event that measures an action that's particularly important to the success of your business". The Traffic acquisition report then shows sessions, engaged sessions, engagement rate and key events by session default channel group. Read the Organic Search and AI Assistant rows.
Cadence: monthly. Signups from a single week are too few to read.
Pipeline and revenue from organic
What it tells you: whether organic visitors become paying customers. This is the number that justifies SEO to a board.
Where to get it: not in Search Console or GA4 alone. Pass the first-touch or last-touch channel into your CRM at signup, using UTM or referrer data, then report qualified pipeline and closed revenue where the source was organic search or an AI assistant. Write the attribution model on the report.
Cadence: quarterly. Sales cycles make monthly revenue swings misleading.
Vanity metrics to stop reporting
These are fine for diagnosis but poor KPIs: a change in them does not tell you what to do next.
| Metric | Why it misleads | Report this instead |
|---|---|---|
| Total keywords ranked | Grows with irrelevant long-tail queries | Impressions and position on target clusters |
| Total organic sessions | One off-topic post can inflate it | Non-branded sessions to key pages, plus key events |
| Site-wide average position | Falls when you gain new, low-ranking queries | Average position per cluster |
| Third-party authority scores | A vendor's estimate, not a Google metric | Indexed key pages and referring links you earned |
| Bounce rate on its own | Says nothing about intent or the next step | Engaged sessions and key event rate |
If someone wants a vanity number, put it in an appendix.
Read Search Console numbers without fooling yourself
A few details in Search Console trip up most teams.
- Tables do not add up to totals. Google omits anonymized queries, those not issued by more than a few dozen users over two to three months, from query tables. They are still counted in chart totals unless you filter by query. Expect a gap, especially on niche B2B topics.
- Recent data is preliminary. Google notes that the newest data in the Performance report can still change. Search Console data reaches GA4 48 hours after collection. Do not read yesterday's dip as a trend.
- History is capped at 16 months. Google states that Search Console keeps data for the last 16 months. Export monthly snapshots if you want year-over-year comparisons beyond that.
You do not need to log in daily. Google's own Search Console guide suggests checking "around once every month, or when you make changes to the site's content", and says it will email you when it finds new issues.
A one-page SEO KPI scorecard by stage
Before product-market fit, traffic is too thin for revenue numbers to mean much, so lean on leading indicators. In early growth, lagging outcomes carry the weight.
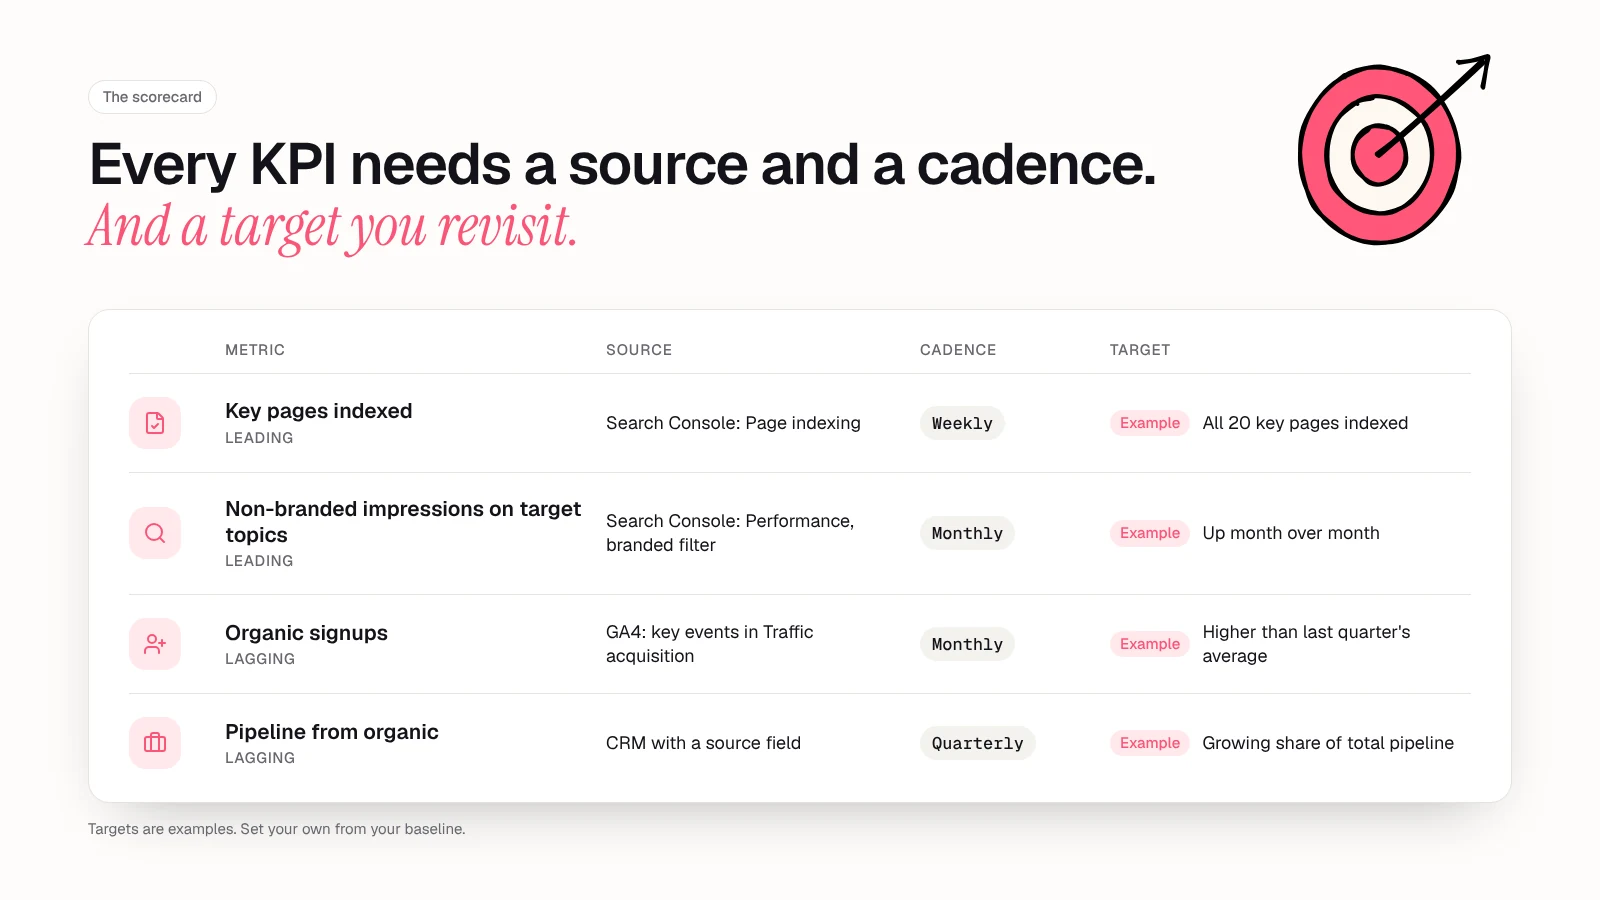
| KPI | Type | Source | Cadence | Pre-PMF | Early growth |
|---|---|---|---|---|---|
| Key pages indexed | Leading | Search Console: Page indexing | Weekly, then monthly | Primary | Health check |
| Non-branded impressions on target topics | Leading | Search Console: Performance, branded filter | Monthly | Primary | Primary |
| Average position per target cluster | Leading | Search Console: Performance | Monthly | Primary | Primary |
| Share of AI answers | Leading | Fixed prompt set; GA4 AI Assistant channel | Monthly | Track | Primary |
| Organic key events (signups, demos) | Lagging | GA4: Traffic acquisition | Monthly | Track | Primary |
| Pipeline from organic | Lagging | CRM with source field | Quarterly | Skip | Primary |
| Revenue from organic | Lagging | CRM and billing | Quarterly | Skip | Primary |
Give each primary KPI a target, and revisit it each review.
Set up the scorecard in an afternoon
- List your key pages. Ten to thirty URLs that sell or support selling.
- Define your target clusters. For each, write the URL path or query pattern you will filter by in Search Console.
- Turn on the branded filter in the Performance report if your property is eligible. If not, build a query regex that excludes your brand name and product names.
- Mark key events in GA4 for signup, demo request and other actions that predict revenue, and link Search Console to GA4.
- Write your AI prompt set. Ten to twenty questions buyers ask when choosing a tool like yours. Run them monthly and log the results.
- Add a source field to your CRM so pipeline and revenue can be filtered by organic search and AI assistants.
- Put it on one page: current value, previous period and target for each KPI.
Then the SEO conversation gets short: which indicator moved, why, and what changes. For the work those numbers measure, go back to the startup SEO playbook.
FAQ
What are the most important SEO KPIs for a startup?
Start with key pages indexed, non-branded impressions on target topics and average position per cluster, because they move first. Add organic signups once traffic is steady, then pipeline and revenue from organic.
How do you measure SEO success?
Measure it in two layers. Leading indicators from Search Console show whether visibility is building on the topics you chose, and lagging outcomes from GA4 and your CRM show whether that visibility turns into signups and revenue. Success is the lagging layer rising after the leading layer did.
What should an SEO KPI dashboard include?
One row per KPI with source, cadence, current value, previous value and target. Keep leading and lagging metrics in separate sections so nobody mistakes a ranking gain for revenue.
How often should you review SEO metrics?
Weekly for indexing while you publish often, monthly for impressions, position, AI answers and organic key events, and quarterly for pipeline and revenue. Google suggests checking Search Console around once a month or after site changes.
What is the difference between SEO metrics and SEO KPIs?
A metric is any number a tool reports. A KPI is a metric you have chosen because it predicts or proves business results, with a target and an owner. Search Console reports dozens of metrics; a startup needs only a handful of KPIs.
Sources
- Google Search Console Help: What are impressions, position, and clicks? (October 2026)
- Google Search Console Help: Performance report (Search results): Overview and basic setup (October 2026)
- Google Search Console Help: Page indexing report (October 2026)
- Google Search Central: How to use Search Console (October 2026)
- Google Search Central Blog: Introducing the branded queries filter in Search Console (November 2025, updated March 2026)
- Google Search Central Blog: Introducing Query groups in Search Console Insights (October 2025)
- Google Search Central Blog: A deep dive into Search Console performance data filtering and limits (October 2022)
- Google Analytics Help: Default channel group (October 2026)
- Google Analytics Help: Traffic acquisition report (October 2026)
- Google Analytics Help: Conversions vs. key events in Google Analytics (October 2026)
- Google Analytics Help: Google organic search traffic report (October 2026)