ICE vs RICE: Which Prioritization Framework Should You Use?
RICE prioritization vs ICE scoring, side by side: both formulas, five growth tasks scored both ways, and which framework fits your team and its data.


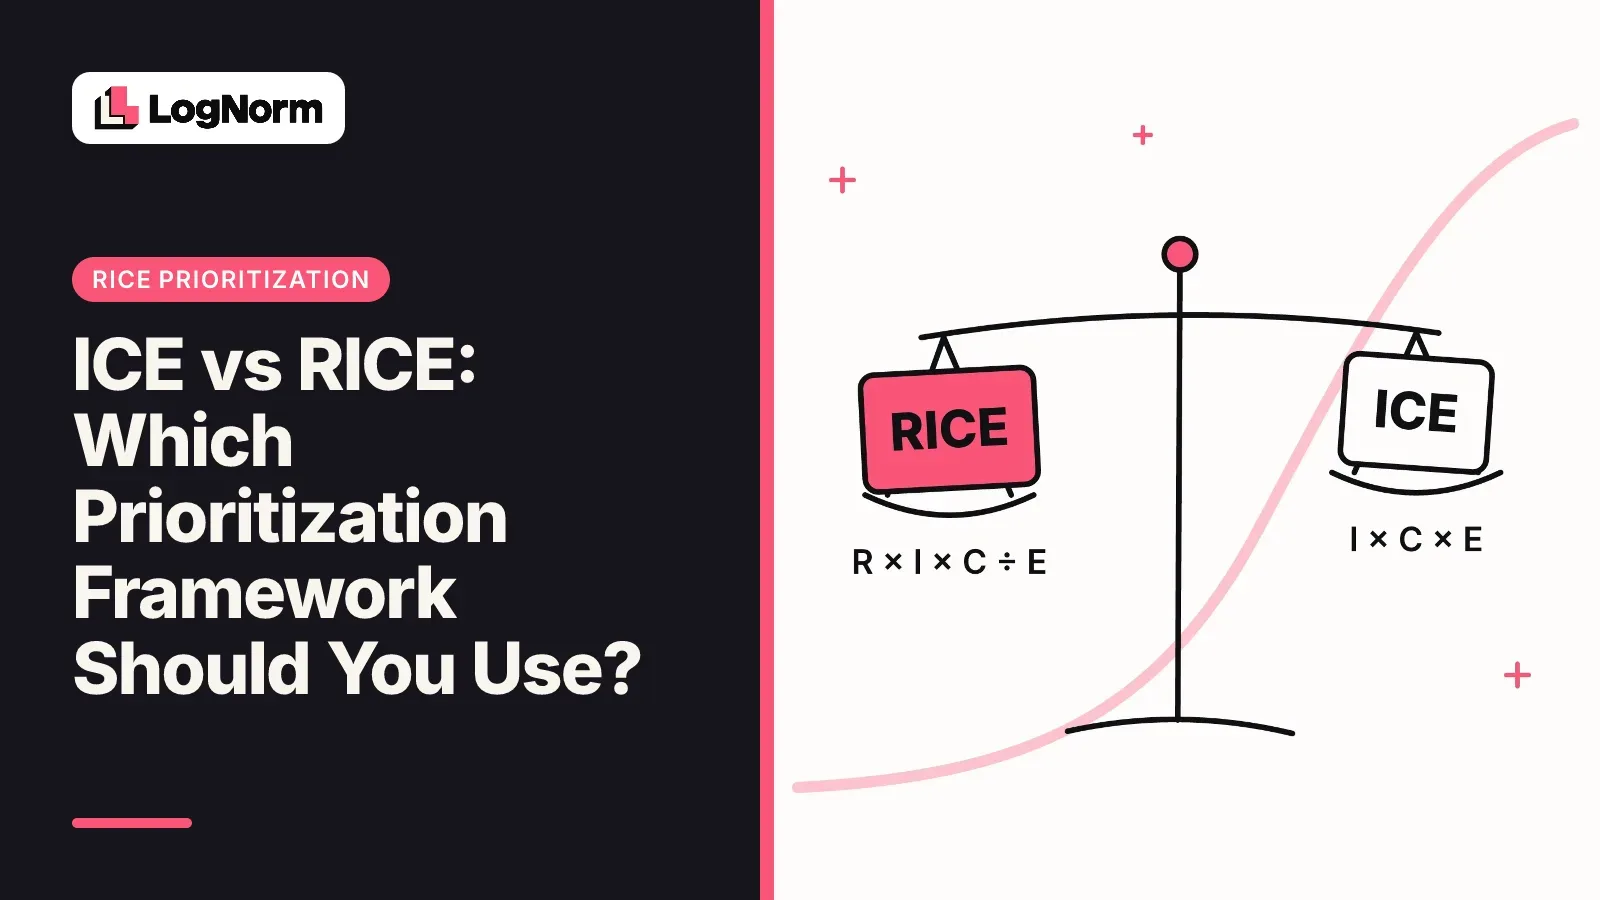
RICE and ICE both turn a messy backlog into a ranked list, but they rank the same work differently. RICE prioritization counts how many people a task reaches and divides by effort. ICE rates three things on a 1 to 10 scale and multiplies them. This guide puts the formulas side by side, scores the same five startup growth tasks both ways, and tells you which one to use.
ICE vs RICE: the short answer
Use RICE when you can count reach and estimate effort in real units; use ICE when you need to triage a long list of small experiments in minutes. That is the whole decision for most teams.
| RICE | ICE | |
|---|---|---|
| Formula | Reach × Impact × Confidence ÷ Effort | Impact × Confidence × Ease |
| Inputs | A count, two fixed scales and person-months | Three ratings from 1 to 10 |
| Reach | Measured (users, sessions, signups per period) | Not included |
| Effort | Divides the score | Rated as Ease, multiplies the score |
| Time per item | A few minutes, needs data | Seconds, needs judgment |
| Best for | Product and SEO work with analytics | Early growth experiments, idea triage |
The difference that matters most is structural. RICE has a real-world count in it and puts effort in the denominator. ICE has neither, so every input is an opinion on the same scale.
How RICE prioritization works
RICE prioritization scores a task as Reach × Impact × Confidence ÷ Effort. RICE comes from Intercom's product team, and its scales are fixed so different people score the same way:
- Reach is the number of people or events the task affects in a set period, such as visitors per quarter.
- Impact is how much it moves each of them: 3 massive, 2 high, 1 medium, 0.5 low, 0.25 minimal.
- Confidence is how much you trust the other estimates: 100% high, 80% medium, 50% low.
- Effort is total work across everyone involved, in person-months.
For growth work, reach is usually the easiest input to get honestly. A page refresh reaches the people who already land on that page. A new comparison page reaches the people searching for that comparison. Search Console impressions and keyword volume give you a starting count.
Keep one period and one effort unit across the whole backlog. A reach of "per month" on one row and "per quarter" on the next silently multiplies some scores by three.
How ICE scoring works
ICE scoring multiplies three ratings from 1 to 10: Impact × Confidence × Ease. It is usually credited to Sean Ellis, who used it to rank growth experiments quickly. Ease is the inverse of effort, so a quick task scores high.
ICE needs no data. That is why growth teams like it for a weekly experiment review, and why it bends so easily toward ideas the room already likes. A dedicated ICE scoring guide covers the ratings in depth; here it only needs to be on the same footing as RICE.
The same five growth tasks, scored both ways
The fastest way to see how RICE and ICE differ is to score one backlog with both. Below are five typical tasks for a startup working on organic growth, with reach per quarter and effort in person-months. The numbers are illustrative, chosen to look like a real small-team backlog.
| Task | Reach | Impact | Conf. | Effort | RICE | ICE (I × C × E) | ICE |
|---|---|---|---|---|---|---|---|
| Refresh a decaying pricing guide | 2,000 | 1 | 80% | 0.25 | 6,400 | 5 × 8 × 9 | 360 |
| Add meta descriptions to 12 pages | 1,500 | 0.5 | 80% | 0.1 | 6,000 | 3 × 7 × 10 | 210 |
| Fix indexing on 40 docs pages | 3,000 | 1 | 80% | 0.5 | 4,800 | 6 × 8 × 8 | 384 |
| Publish an "Acme vs Globex" comparison page | 600 | 3 | 50% | 1 | 900 | 9 × 5 × 6 | 270 |
| Build a free calculator tool | 1,200 | 2 | 50% | 2 | 600 | 8 × 4 × 3 | 96 |
The two frameworks produce different orders:
| Rank | RICE order | ICE order |
|---|---|---|
| 1 | Refresh pricing guide (6,400) | Fix indexing (384) |
| 2 | Meta descriptions (6,000) | Refresh pricing guide (360) |
| 3 | Fix indexing (4,800) | Comparison page (270) |
| 4 | Comparison page (900) | Meta descriptions (210) |
| 5 | Free calculator tool (600) | Free calculator tool (96) |
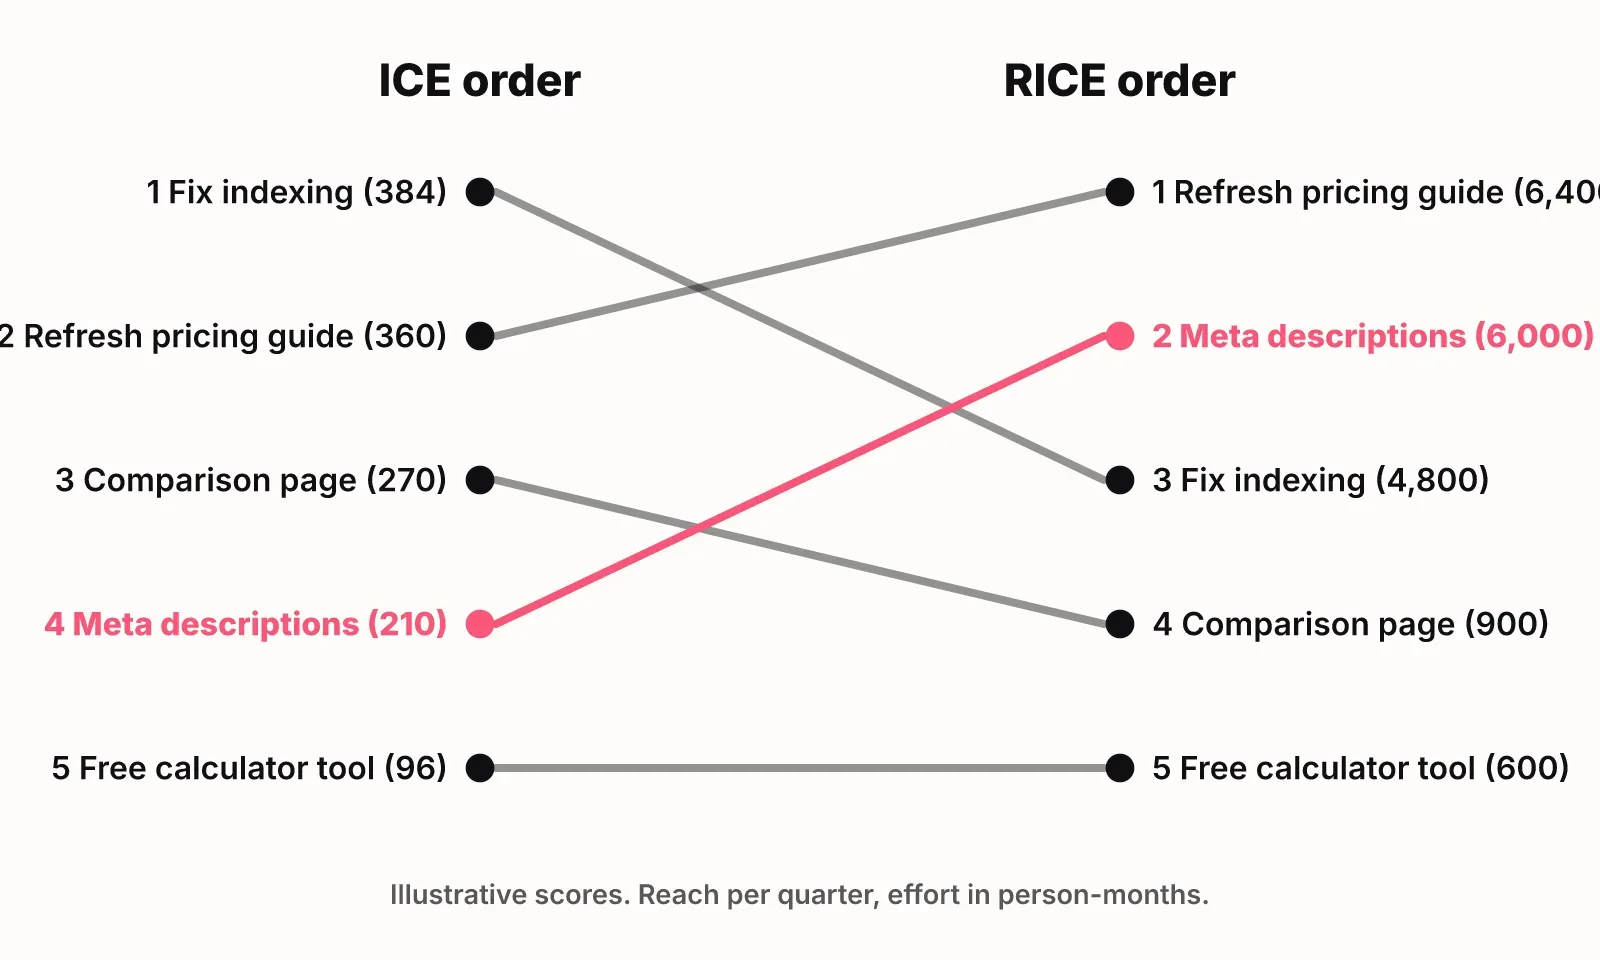
Meta descriptions jump from fourth under ICE to second under RICE. The reason is the denominator: 0.1 person-months turns a low-impact task into a near winner. Under ICE, the same task's low impact rating of 3 drags it down, because nothing in ICE says it touches 1,500 people.
The comparison page moves the other way. ICE puts it third because a 9 on impact is persuasive. RICE puts it fourth because 600 searchers a quarter is a small reach and 50% confidence halves the score.
Both agree the free tool comes last. When two frameworks agree, you can trust that call. When they disagree, the disagreement shows you which assumption to argue about: here, whether buyers on a comparison page are worth more than casual visitors on a pricing guide. You can rerun this table with your own numbers in LogNorm's free RICE and ICE calculator.
When to use RICE and when to use ICE
Pick RICE if you have analytics or Search Console data and a backlog of tasks with different audiences. Pick ICE if you have no data yet or you are choosing between many small, similar experiments.
| Your situation | Use | Why |
|---|---|---|
| Pre-launch or first months, little traffic | ICE | You cannot count reach yet, and speed matters more than precision |
| Weekly growth experiment review | ICE | Many small bets with similar effort; ratings take seconds |
| SEO backlog with Search Console data | RICE | Impressions and keyword volume give a real reach number |
| Product features with usage analytics | RICE | Reach per feature is measurable and varies a lot |
| Mixed backlog of fixes, pages and campaigns | RICE, or pairwise ranking | Reach and effort vary too much for 1 to 10 ratings |
Never mix the two in one list. A RICE score of 900 and an ICE score of 270 are on different scales and cannot be sorted together.
Where each framework breaks
RICE breaks on tiny efforts and guessed reach; ICE breaks on drift toward favorite ideas. Knowing the failure mode tells you what to watch for in review.
RICE failure modes:
- Small denominators inflate scores. Any task under a week of work can outrank a strategic one, as the meta descriptions row shows. Set a floor, such as 0.25 person-months, for every task.
- Reach for new pages is a guess dressed as a count. A page that does not exist has no traffic; keyword volume is an upper bound, not a forecast.
- Confidence gets counted twice. People shrink impact when they are unsure, then lower confidence as well.
ICE failure modes:
- Ratings drift. The person proposing the idea rates it, and nobody rates their own idea a 4.
- No reach. A page for 50 visitors and a page for 5,000 can get identical scores.
- Multiplying punishes any low rating hard. A 2 on ease sinks an idea even when impact is a 10.
Both frameworks share one more problem: false precision. A 410 and a 395 are a tie. Teams that treat the order as exact spend the time the score was meant to save debating the decimals, and they rarely re-score once the backlog changes.
Pairwise ranking: a third way to order a backlog
Pairwise ranking skips the score and compares two tasks at a time: if the team can only do one of these this week, which comes first? People are better at that question than at rating something 7 out of 10, because it forces the trade-off into the open.
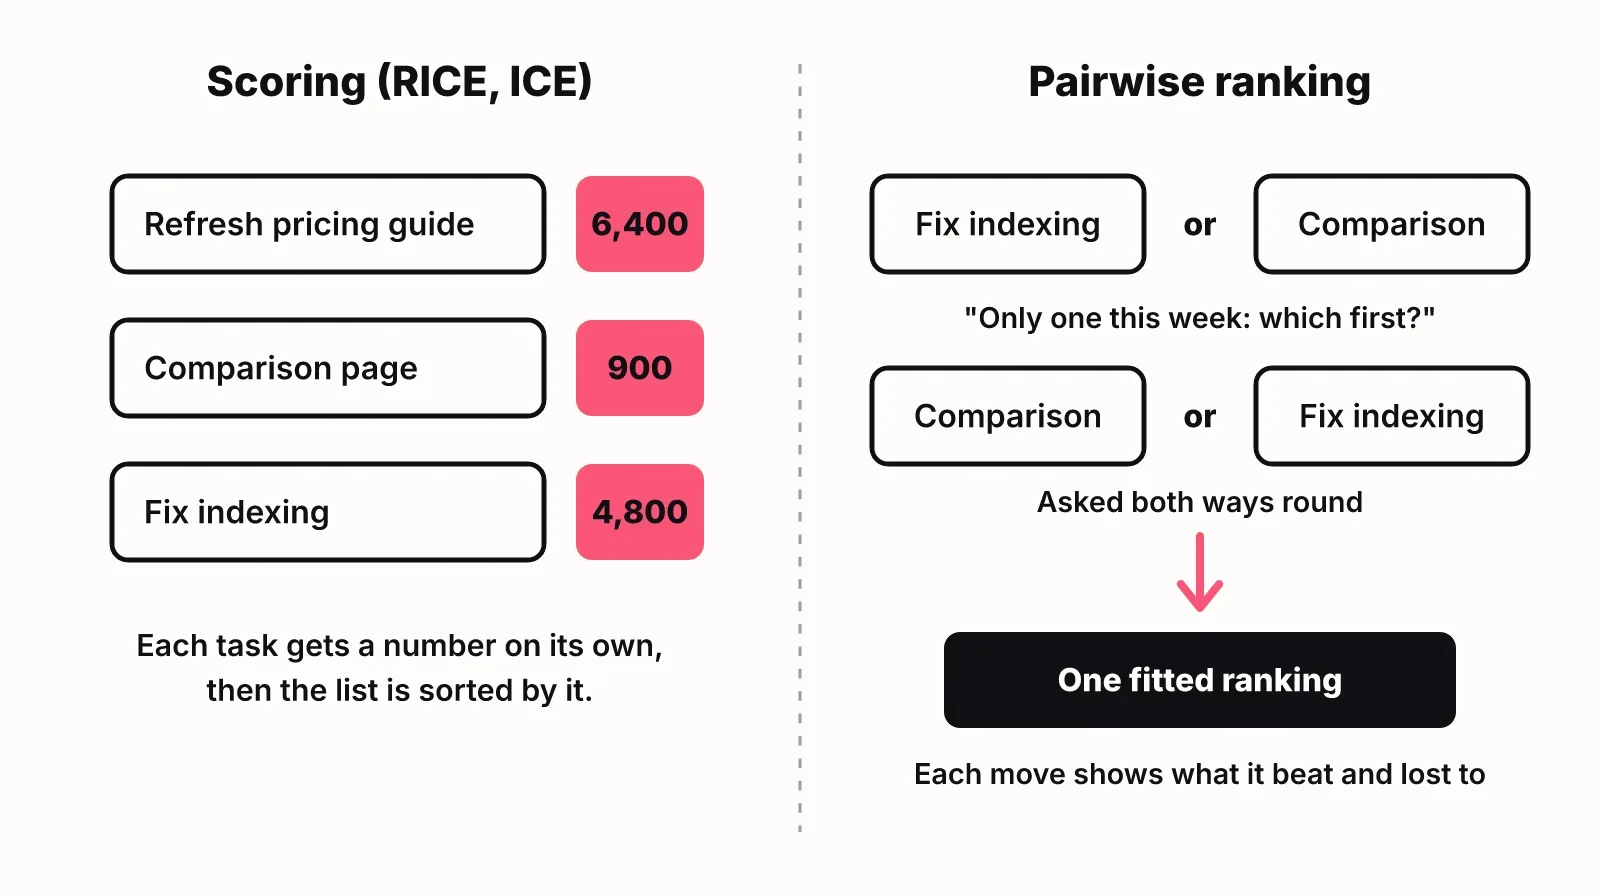
This is how LogNorm orders growth work. Every finding from the site audit, Search Console, keyword research, competitors and AI answers becomes a move (a page to write, a fix to ship, a refresh). LogNorm compares open moves head to head, asks each pair both ways round so the reading order does not bias the answer, and fits one ranking from those calls. Each move shows the moves it beat and the moves it lost to, so you can see why it sits where it does. Moves still carry impact, confidence and effort signals, but they feed the comparisons rather than produce the priority directly. You can override the order, and LogNorm keeps your calls on later passes.
Pairwise ranking is the better choice for a mixed backlog where tasks are hard to put on one scale, such as a technical fix against a new comparison page. A quick RICE pass is enough when every task has comparable data and you need a list today.
Turning SEO tasks into a prioritized growth backlog
A usable SEO backlog for a startup is one list, ordered by one method, sized to what the team can ship this week. These steps get you there:
- Put every task in one list with its evidence: the audit finding, the Search Console rows, the keyword, the competitor page. A task without evidence goes to the bottom.
- Choose one method. RICE if you have Search Console data, ICE if you do not, pairwise if the list mixes fixes, pages and refreshes.
- Fix one period and one effort unit, then score or compare every task once.
- Set a weekly target of tasks your team can actually finish and take only that many from the top.
- Record a baseline when each task ships and check it again after four weeks and after three months, so the next round of scoring uses real outcomes.
- Re-rank when new data arrives instead of on a fixed date.
Steps 4 to 6 are where most spreadsheets stop working. LogNorm runs that loop as a ranked weekly plan for SEO work: it sizes the week to your team and measures shipped moves at 28 and 90 days. If you are deciding between a data tool and a plan, the LogNorm vs Semrush comparison covers the difference between a data suite and a growth plan. And if your backlog includes AI answer visibility, read GEO vs SEO before you score those tasks, because their reach is measured differently.
FAQ
What is the RICE scoring model?
The RICE scoring model is a prioritization framework that ranks work by Reach, Impact, Confidence and Effort. It favors tasks that touch many people for little work, and it uses fixed scales so scores from different people can be compared.
How is a RICE score calculated?
Multiply reach by impact by confidence, then divide by effort. For example, 2,000 visitors × 1 (medium impact) × 80% ÷ 0.25 person-months gives a RICE score of 6,400.
Is ICE or RICE better for a startup?
ICE is better before you have traffic data, because it needs only judgment. RICE is better once you have analytics or Search Console, because reach separates tasks that ICE would score the same.
How often should you review your prioritization framework?
Re-score whenever new data changes an input, such as a page losing clicks or a competitor publishing on your keyword, and review the framework itself once a quarter. If scores never change between reviews, nobody is updating the inputs.
Can a prioritization framework improve team collaboration?
Yes, when the inputs are visible. A shared score or a recorded head-to-head call turns "I think" into a specific assumption the team can check, such as a reach number or a confidence level.
Can you average ICE ratings instead of multiplying them?
You can, and some teams do. Averaging lets one strong rating carry a weak one, while multiplying punishes any low rating. Pick one rule and keep it, because switching changes the order of tasks with uneven ratings.