ICE Scoring: The Definitive Guide, With a Worked SEO Example
ICE scoring explained with a worked example on SEO and growth tasks, its weak spots (inflation, ties, gut feel) and how pairwise ranking fixes them.



ICE scoring ranks ideas by multiplying three 1 to 10 ratings: Impact, Confidence and Ease. It is the fastest prioritisation framework a small growth team can adopt, and it is also easy to fool. This guide shows the formula, scores six real SEO and growth tasks with it, shows where the ranking falls apart, and shows how comparing tasks head to head fixes the weak spots.
What is ICE scoring?
ICE scoring is a prioritisation method that rates each idea from 1 to 10 on Impact, Confidence and Ease, then ranks the ideas by the combined score. It is usually credited to Sean Ellis, who popularised it for growth teams choosing which experiments to run next.
The three factors ask simple questions:
- Impact: if this works, how much will it move the metric you care about this quarter?
- Confidence: how sure are you that it will work, based on evidence rather than enthusiasm?
- Ease: how little time and help does it need? A 10 is an afternoon for one person.
ICE exists for speed. A founder can score a 30-item backlog in under an hour, which is why it shows up in growth teams, product teams and startup marketing plans long before anyone buys a roadmap tool.
The ICE scoring formula
The ICE scoring formula is Impact × Confidence × Ease, which gives a score between 1 and 1,000. Some teams average the three numbers instead and get a score between 1 and 10.
Pick multiplication. It punishes any weak factor: a brilliant idea with a Confidence of 2 cannot hide behind a high Impact. Averaging lets one strong number cover for a weak one, so risky ideas float up.
The formula is only as good as the scale behind it. Write down what each number means before anyone scores, or every person on the team will use a different ruler. Here is a scale written for SEO and growth work:
| Score | Impact | Confidence | Ease |
|---|---|---|---|
| 1 to 3 | Touches a page or query almost nobody sees | Opinion or a hunch | Weeks of work or needs engineering time you don't have |
| 4 to 6 | Moves a page or query with steady traffic | A competitor does it, or a tool flags it | A few days for one person |
| 7 to 8 | Moves one of your top pages or a buying query | Your own Search Console or analytics data points to it | One or two days |
| 9 to 10 | Changes the quarter's main metric | You ran it before and it worked | Hours |
The Confidence column matters most. Tying it to the kind of evidence you hold, not to how excited you feel, removes the largest source of bias in ICE.
A worked ICE example: six SEO and growth tasks
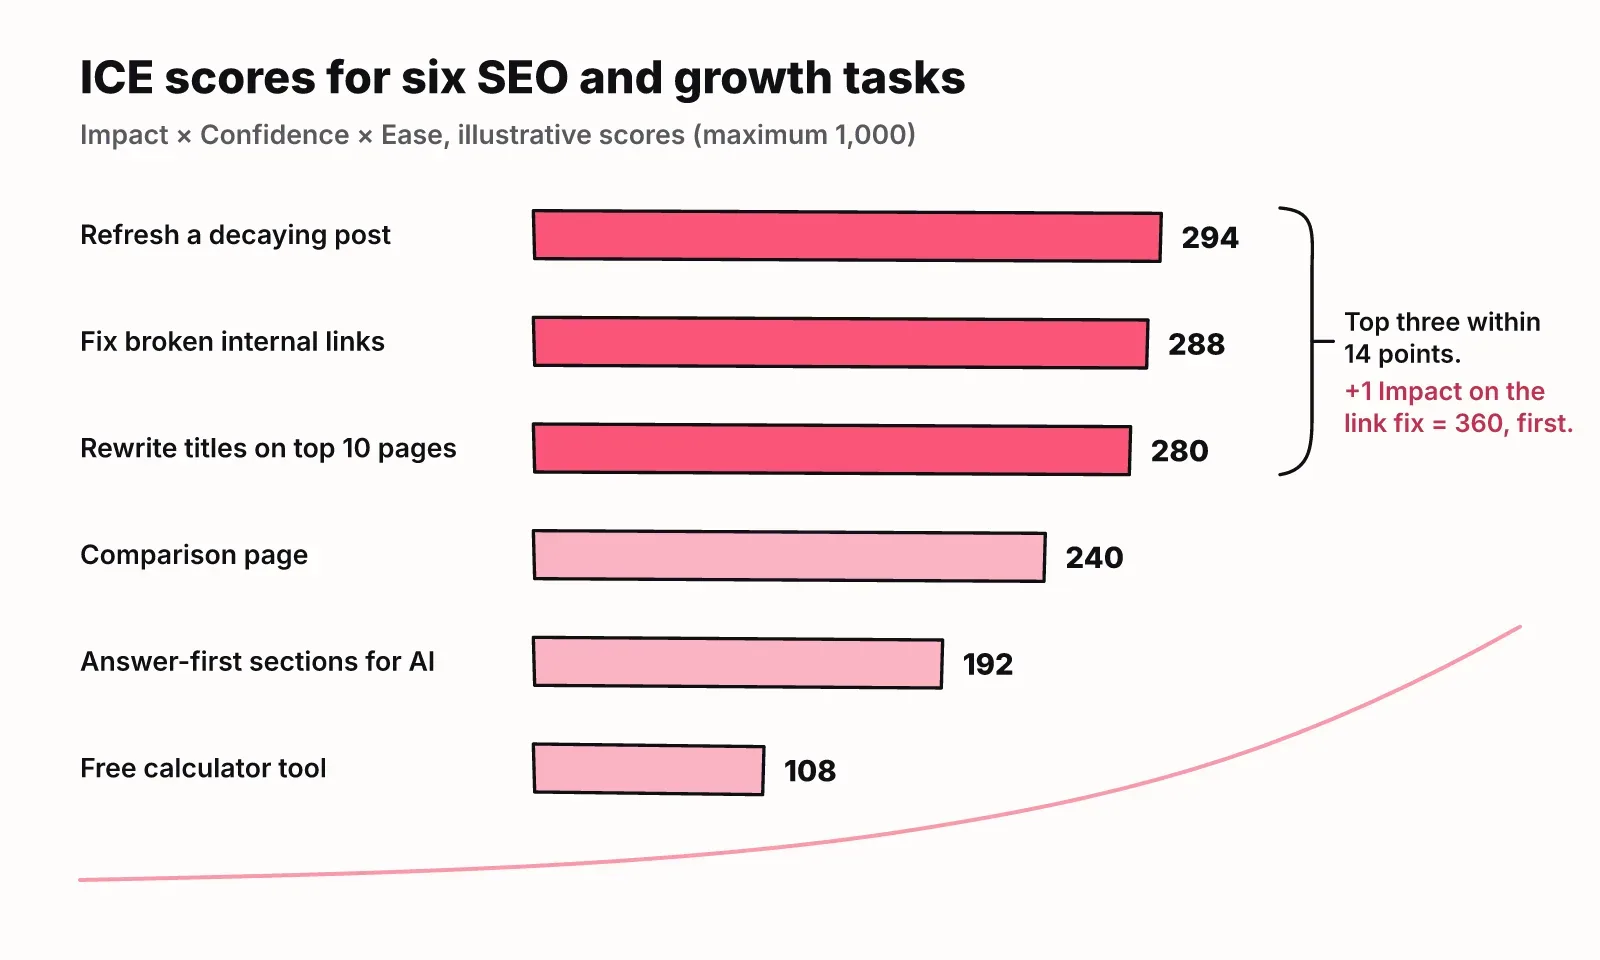
Here is ICE applied to six tasks a typical startup has in its backlog. The scores are illustrative, using the scale above.
| Task | Impact | Confidence | Ease | ICE score |
|---|---|---|---|---|
| Refresh a blog post that has been losing clicks | 6 | 7 | 7 | 294 |
| Fix broken internal links found in a site audit | 4 | 8 | 9 | 288 |
| Rewrite title tags on the 10 pages with the most impressions | 5 | 7 | 8 | 280 |
| Publish a comparison page against your main competitor | 8 | 6 | 5 | 240 |
| Add answer-first sections so AI assistants can quote your pages | 6 | 4 | 8 | 192 |
| Build a free calculator tool | 9 | 4 | 3 | 108 |
The free tool has the highest Impact on the list and still finishes last, because low Confidence and low Ease multiply together. That is ICE working as intended.
Now look at the top three. They sit within 14 points of each other. Raise the Impact of the broken-link fix from 4 to 5 and its score jumps to 360, straight to first place. Switch from multiplying to averaging and the broken-link fix also wins (7.0 against 6.7 for the next two, which tie). One point, or one choice of formula, reorders the week.
For choosing which pages belong in the backlog in the first place, see our guide to turning a keyword list into a ranked backlog.
Where ICE scoring breaks
ICE breaks in four predictable ways, and all of them come from scoring each item alone on a scale nobody calibrates.
- Score inflation. People defend their own ideas with an extra point. After a few weeks most items sit between 6 and 8, and a 1 to 10 scale behaves like a 6 to 8 scale.
- Near-ties. As the example shows, the gap between first and third place is often smaller than one person's disagreement on one number. The product looks precise, but the order is fragile.
- Gut-feel inputs. Confidence is supposed to measure evidence. In practice it often measures mood, and Impact gets guessed for work nobody has sized.
- No reasons on record. A score of 288 tells you nothing about why. When someone asks next month why the comparison page waited, nobody remembers.
The anchored scale above helps with the first and third problems. It does nothing for ties or the missing reasons. For those you need a different kind of judgement.
Fixing ICE with pairwise ranking
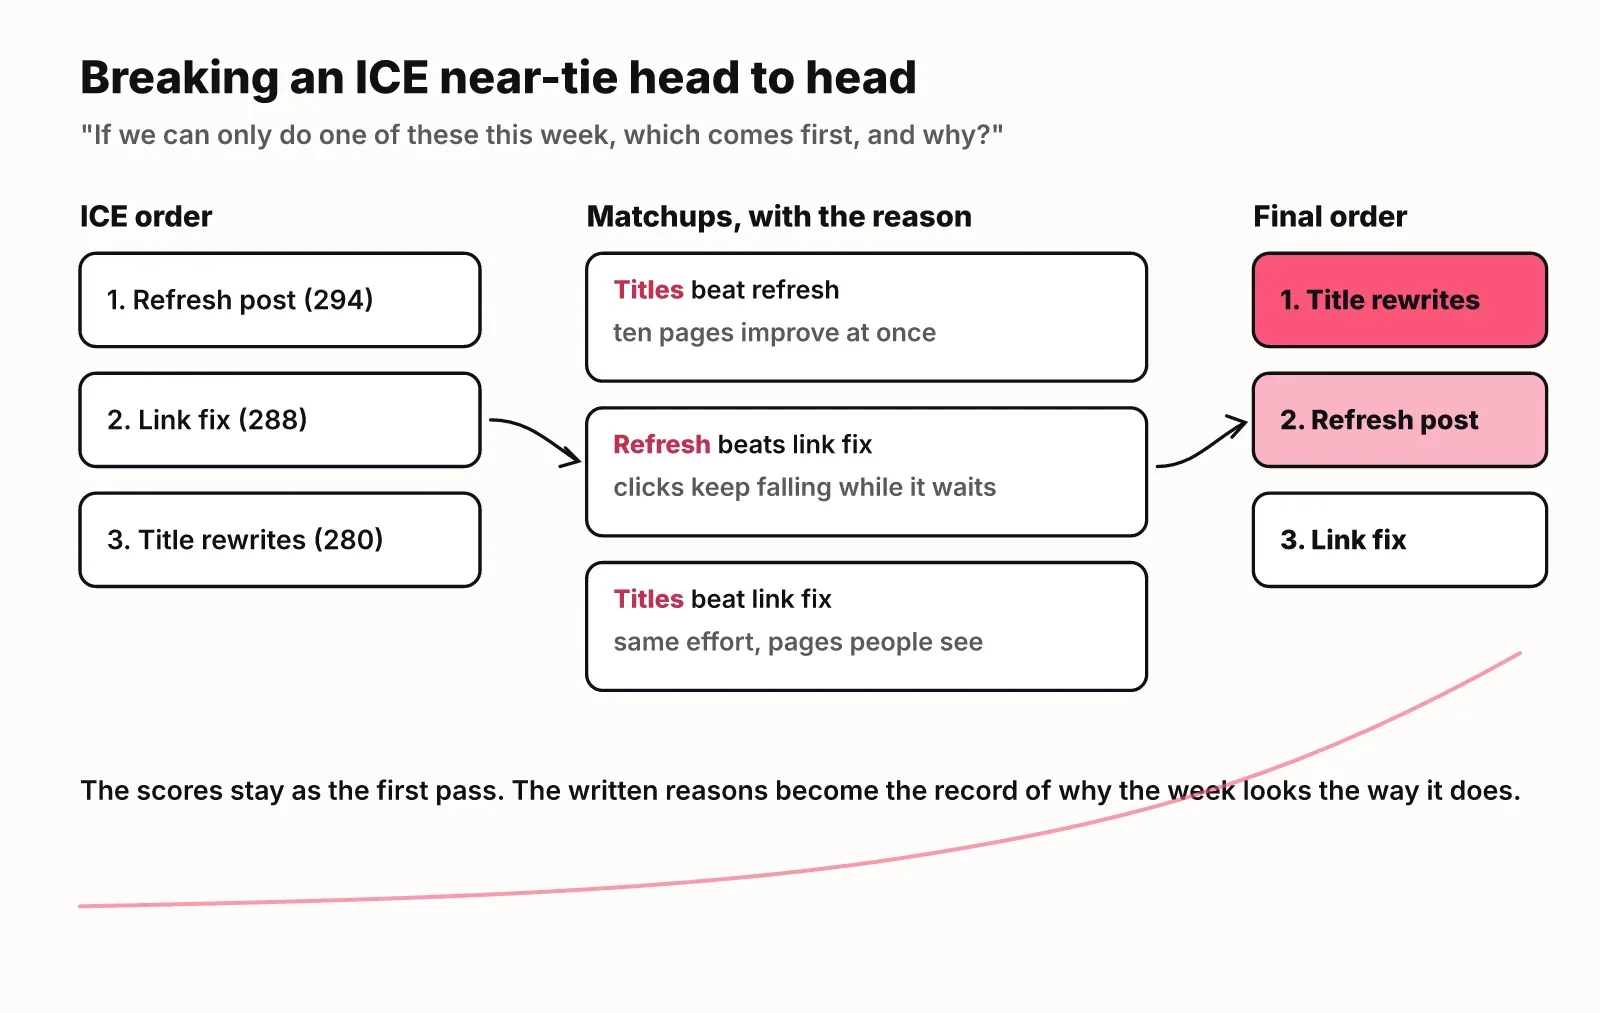
Pairwise ranking fixes ICE's ties and inflation by comparing two tasks at a time and asking one question: if we can only do one of these this week, which comes first, and why? People who disagree on whether something is a 6 or a 7 usually agree quickly on which of two tasks should go first.
Keep the ICE scores as your first pass, then run head-to-head calls on the items that sit close together. Here is that pass on the three near-tied tasks from the example:
| Matchup | Winner | Reason written down |
|---|---|---|
| Title rewrites vs refresh | Title rewrites | Ten pages improve at once, and Search Console shows the change within weeks |
| Refresh vs broken-link fix | Refresh | The post loses clicks every week it waits; the broken links sit on low-traffic pages |
| Title rewrites vs broken-link fix | Title rewrites | Same effort, but it touches the pages people actually see |
The final order is title rewrites, then the refresh, then the broken-link fix. ICE had the title rewrites third. The scores were not wrong, they were just too close to decide, and the comparisons brought out context the numbers flattened: how many pages each task touches, and what waiting costs.
You don't need to compare every pair. A full round for 30 items is 435 matchups. Inserting each new item into an already ordered list, the way you would sort a hand of cards, takes roughly 150 comparisons for 30 items, and far fewer if you only use pairwise calls to settle near-ties.
The written reasons are the part teams skip and the part that pays off. They turn the backlog into a record of decisions you can revisit when results come in.
This is how LogNorm ranks growth work. Each move carries impact, confidence and effort signals, but LogNorm does not score a move in isolation. It compares open moves head to head, asking which should come first if the team can only do one this week, and fits one ranking from those calls. Every move shows the moves it beat and the moves it lost to, and when you drag a move higher or lower, LogNorm keeps your call on every later pass. You can see how LogNorm ranks and ships moves on the product page.
ICE vs RICE in one minute
RICE adds Reach to ICE and treats effort as a divisor: Reach × Impact × Confidence ÷ Effort. Reach counts how many people the work affects in a set period.
For SEO work, Reach maps cleanly to monthly search volume or Search Console impressions. Use RICE when reach varies widely across your backlog, for example a sitewide fix next to a single niche page. Use ICE when items touch similar audiences, or when you have no reliable reach numbers yet. Both share ICE's weak spots, because both score items alone, so the pairwise step applies to RICE as well.
How to turn SEO tasks into a ranked growth backlog
To prioritise SEO tasks into an actionable growth backlog, collect every task with its evidence, score each with ICE on an anchored scale, break near-ties by comparing tasks head to head with a written reason, commit only as many tasks as the team can finish this week, and re-rank weekly as results arrive.
- Collect. Write every fix, page and refresh as one concrete task, with the data that justifies it: the audit row, the Search Console query, the competitor page, the AI answer that skips you.
- Score. Give each task Impact, Confidence and Ease on the anchored scale. Multiply.
- Compare. For any tasks within about 15 percent of each other, decide head to head and write one sentence of reasoning.
- Commit. Take the top of the list down to your weekly capacity, not further.
- Measure and re-rank. Check what moved after a few weeks, feed that back into Confidence, and rerun the comparisons when new tasks arrive.
The fifth step is what makes a list into a growth engine. Tasks you proved once earn a higher Confidence next time, and ones that flopped teach you to score lower. This applies to AI visibility work too: tasks aimed at generative engine optimization belong in the same backlog, compared against classic SEO fixes, not on a separate list.
FAQ
What does ICE stand for?
ICE stands for Impact, Confidence and Ease. Some teams write Effort instead of Ease; then a high Effort score is bad, so flip the scale or divide by it.
How is ICE scoring calculated?
Rate Impact, Confidence and Ease from 1 to 10, then multiply them. A task rated 6, 7 and 7 scores 294 out of a possible 1,000. Averaging the three is a common variant, but it lets one strong score hide a weak one.
Who created ICE scoring?
ICE scoring is generally credited to Sean Ellis, who popularised it for growth teams prioritising experiments.
Who should use the ICE scoring model?
ICE suits small teams with more ideas than time and no reliable reach data: startup founders, growth marketers and product teams running quick experiments. Larger teams with good traffic data often move to RICE.
What are the strengths and weaknesses of ICE scoring?
ICE is fast, easy to explain and needs no data to start. Its weaknesses are score inflation, near-ties that hide a fragile order, and gut-feel Confidence. Anchored scales and head-to-head comparisons fix most of them.
How often should you re-score items using ICE?
Re-score weekly, or whenever new evidence arrives, such as a test result, a Search Console change or a competitor launch. Confidence should move most, since it is the factor evidence changes.