Growth Experiments: How to Run Them With a Small Team
Run growth experiments with a small team: a one-page hypothesis template, honest sizing for low traffic, a stop rule, a results log and a ranked backlog.


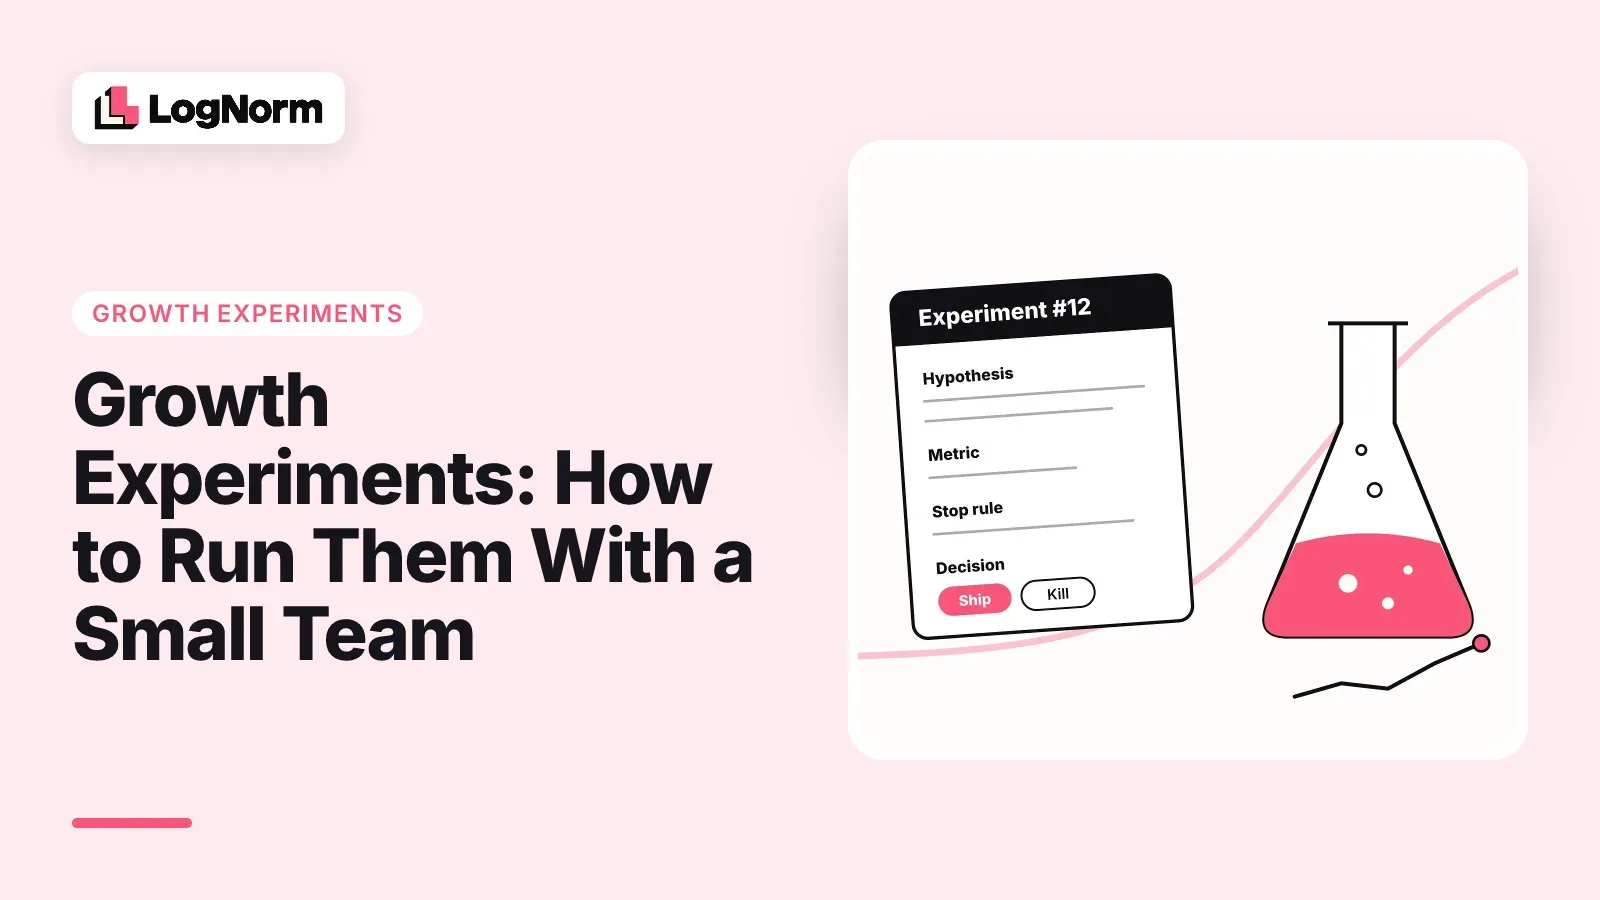
Growth experiments are how a small team stops arguing about ideas and starts collecting evidence. You write down a bet, decide in advance how you will judge it, run it for a fixed time and record what happened. The hard part for a team of one to three people is not the idea. It is running tests you can actually read with the traffic you have, and keeping the habit going when everyone also has a product to ship.
This guide gives you a one-page template, an honest way to size tests when traffic is low, a weekly cadence, a stop rule and a simple way to pick what to test next.
What a growth experiment is (and what it is not)
A growth experiment is a single change you make on purpose, with a written prediction, one metric and a deadline, so that the result teaches you something whether it wins or loses. The prediction is what makes it an experiment. Without it, you are shipping and hoping.
Plenty of growth work does not need to be an experiment. Fixing a broken signup form, adding missing meta descriptions or publishing a page buyers are already searching for are things you would do anyway. Treat those as tasks and ship them. Save the experiment format for bets where you genuinely do not know the answer and the answer would change what you do next.
A useful test for the difference: if a negative result would not change your plan, it is a task, not an experiment.
The one-page hypothesis template
Every experiment fits on one page with nine fields. If you cannot fill one in, the experiment is not ready to launch.
- Change: the one thing you will do differently.
- Audience: who sees it (all visitors, new signups, one channel, one segment).
- Primary metric: the single number that decides the result.
- Prediction: the direction and rough size of the change you expect.
- Reason: the evidence that makes you believe it (user interviews, support tickets, search data, a competitor page that ranks).
- Method: split test, before and after, or a holdout group.
- Stop rule: the date or sample at which you will read the result, and the only condition for stopping early.
- Owner: one person.
- Decision in advance: what you will do if it wins, loses or shows nothing.
Here is a filled-in example for a small B2B SaaS team.
| Field | Example |
|---|---|
| Change | Replace the pricing page hero with a short comparison against the manual alternative |
| Audience | All visitors to the pricing page |
| Primary metric | Trial starts from the pricing page |
| Prediction | Trial starts go up noticeably, because the page answers the cost question earlier |
| Reason | Sales calls keep returning to "why not just do this in a spreadsheet" |
| Method | Before and after, four weeks each, same traffic sources |
| Stop rule | Read on the planned end date; stop early only if trial starts drop sharply |
| Owner | Founder |
| Decision in advance | Win: keep and test the same message in onboarding. Loss or flat: revert, log, move on |
The "decision in advance" field does most of the work. It stops you from reinterpreting a flat result as a partial win after the fact.
Sizing: what a small team can actually detect
With little traffic, a split test can only detect large differences, so a small team should either test bold changes or measure smaller bets over a longer window. This is the honest constraint most growth experiment guides skip.
A split test compares two groups and asks whether the gap between them is bigger than random noise. With few visitors per group, random noise is large. A modest real improvement hides inside that noise, and the test comes back inconclusive no matter how long you stare at it. The smaller the change you hope to see, the more visitors you need to see it.
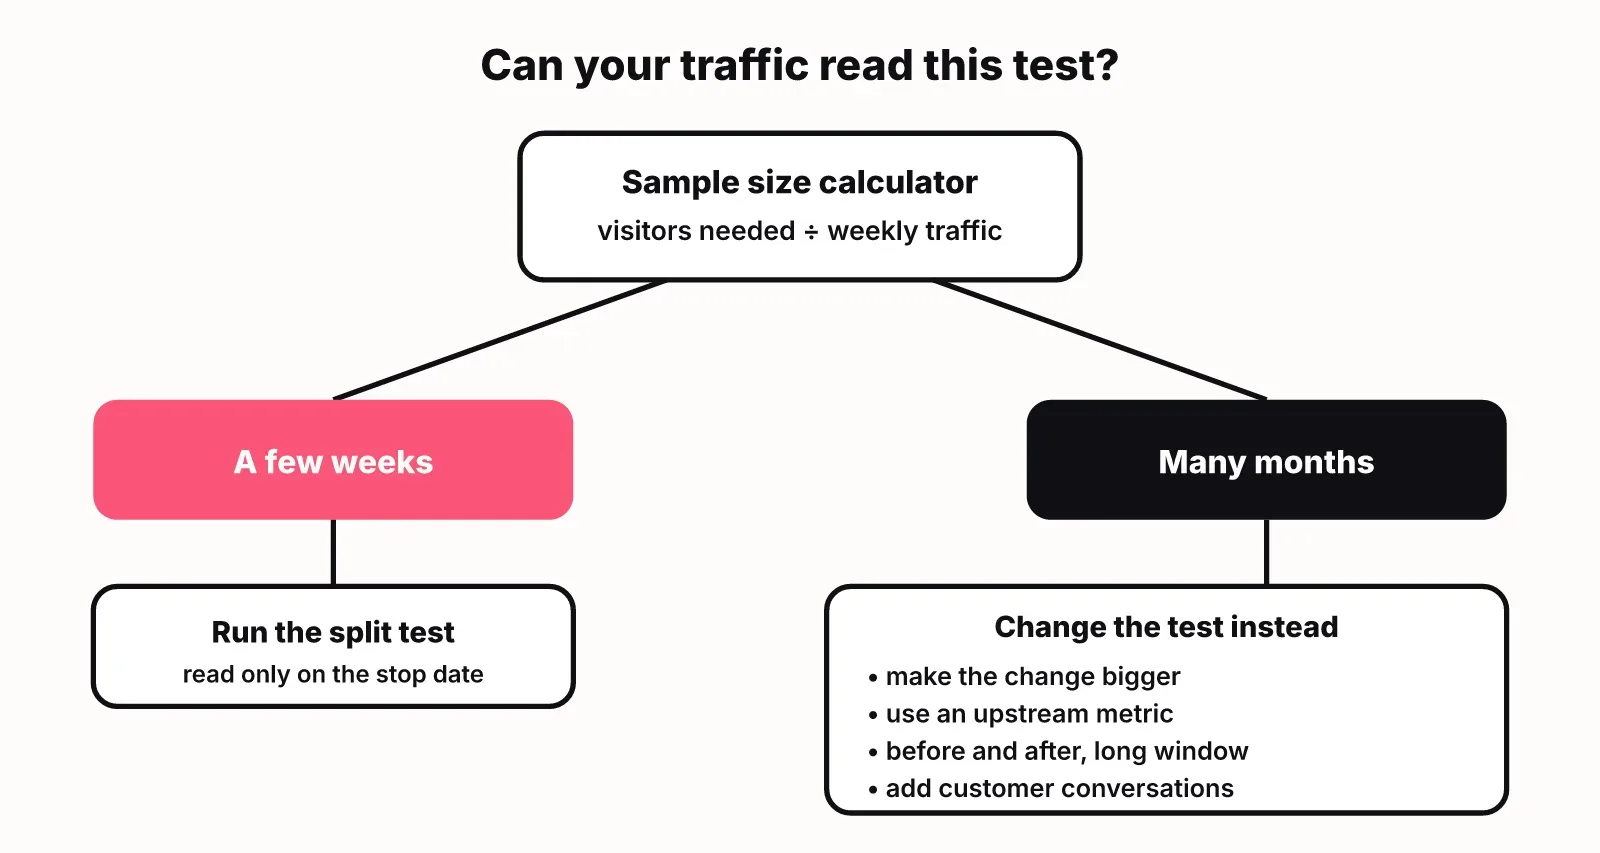
Before you launch, put your current conversion rate, your weekly traffic and the smallest lift you care about into any standard sample size calculator. It tells you how many visitors each variant needs. Divide by your weekly traffic. If the answer is a few weeks, run the split test. If the answer is many months, a split test is the wrong tool for this question.
When the numbers do not work, you still have good options:
- Make the change bigger. Test a different offer, a different page structure or a different audience instead of a button colour. Big changes produce big effects or clear failures, and both are readable.
- Move the metric upstream. Clicks to pricing happen far more often than paid conversions, so you can read them sooner. Accept that you are testing a leading signal, and say so in the log.
- Use before and after with a long window. Compare equal periods, keep traffic sources steady and write down anything else that changed (a launch, a holiday, a newsletter). It is weaker evidence than a split test, but it is honest evidence if you record the caveats.
- Pair numbers with qualitative signal. Five customer calls about a new onboarding step can tell you more than a split test that will never reach significance.
The mistake to avoid is running an underpowered split test, getting a noisy result and calling it a win. That is how small teams ship changes that did nothing and stop trusting their own data.
A weekly cadence a small team can keep
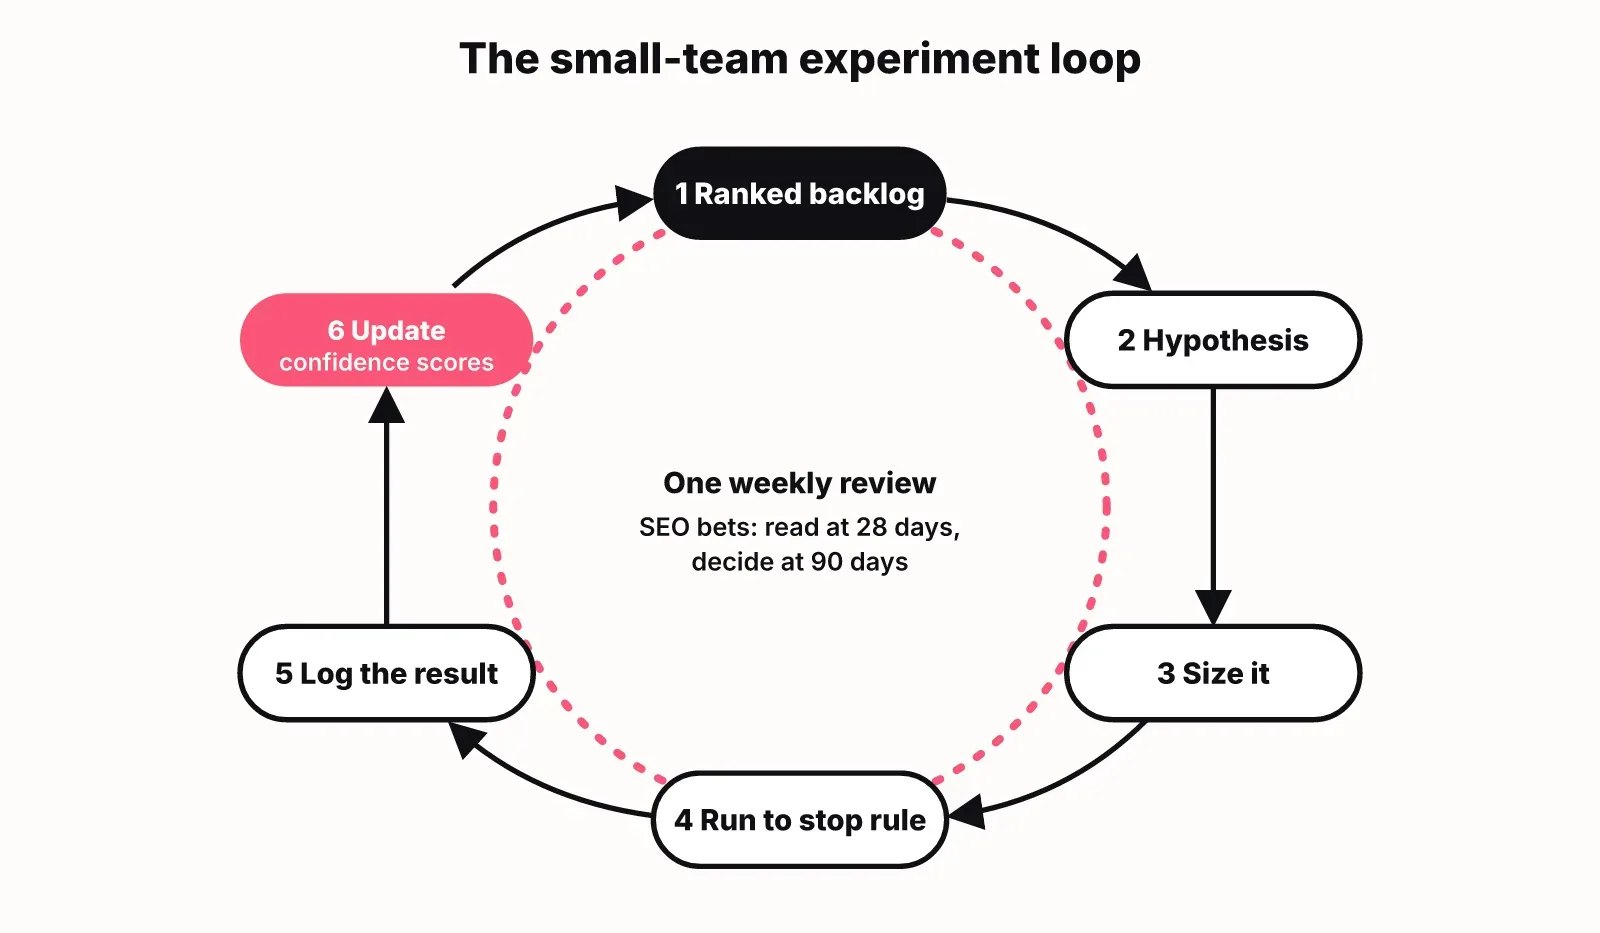
Run one short experiment review each week, at the same time, and launch at most one new experiment from it. A small team that runs two clean experiments a month learns more than one that starts ten and reads none of them.
A 30-minute weekly review covers three things:
- Read any experiment that reached its stop date. Record the result and the decision in the log.
- Check running experiments for harm only. Do not read the main metric early.
- Pick the next experiment from the top of the ranked backlog, fill in its one-page template and assign an owner.
Cap work in progress. If an experiment needs a developer for a week, it competes with product work, so count it against the team's real capacity. LogNorm's Growth Plan works the same way: you set a weekly target for how many pieces of growth work the team can realistically finish, and the plan is sized to it rather than to the length of the idea list.
Write the stop rule before you launch
A stop rule says exactly when you will read the result and the only reason you would stop early. Write it before launch, because once the chart starts moving, every team is tempted to stop at the moment the result looks best.
Reading a test every day and stopping when it crosses your threshold makes false wins far more likely, because noise crosses thresholds all the time. The fix is simple: pick the end date or sample size from your sizing step, and do not read the primary metric until then.
A good stop rule has two parts:
- The planned read: "We read trial starts on the end date, after the planned number of weeks."
- The harm exit: "We stop early only if signups or revenue fall sharply, or something breaks."
SEO and content experiments need a longer stop rule than page tests. New pages take weeks to be crawled, indexed and settle into a position, so reading them after a few days tells you nothing. LogNorm records a baseline when a page is published and measures again at 28 and 90 days, marking moves that lift clicks, impressions or position as won. Use the same two checkpoints for your own content bets: 28 days for an early read, 90 days for the decision.
Log every result, including the losses
Keep one results log for every experiment, win or lose, because the log is what turns individual tests into a team that gets better at guessing. A spreadsheet is enough.
| Column | What goes in it |
|---|---|
| Experiment | Name and link to its one-page template |
| Dates | Launch and planned read date |
| Prediction | What you expected, copied from the template |
| Result | What happened to the primary metric, with the caveats |
| Confidence | Clear win, clear loss or inconclusive |
| Decision | Ship, revert, iterate or retest bigger |
| Lesson | One sentence you would tell a new teammate |
Losses are the most useful rows. A clear loss removes a whole family of ideas from the backlog. An inconclusive result is also information: it usually means the change was too small for your traffic, which tells you to test something bolder next time.
Review the log once a quarter. Look for patterns in which kinds of predictions came true. If the team keeps overestimating the effect of copy changes, lower your confidence scores for copy ideas in the backlog.
Pick the next experiment from a ranked backlog
The next experiment should be the top item of a ranked backlog, not whatever someone suggested in the last meeting. Ranking forces you to compare ideas against each other with the same criteria.
The common way to rank is a simple score. ICE rates each idea on impact, confidence and ease. RICE adds reach and divides by effort, which helps when ideas touch very different numbers of users. You can score a list quickly with LogNorm's RICE and ICE score calculator. We cover the trade-offs in our guides to ICE scoring and to ICE vs RICE.
Two habits make the backlog better over time:
- Feed results back into confidence. A clear win raises confidence for similar ideas; a clear loss lowers it. This is where the results log pays off.
- Compare ideas head to head when scores tie. Scores drift, and two ideas with the same ICE number can be very different bets. Asking "if we can only run one of these this week, which goes first?" often settles it faster than re-scoring.
LogNorm ranks growth work that way. It compares open moves head to head and fits one ranking from those calls, and each move shows which moves it beat and which it lost to. You can override the order, and your calls are kept on later passes. See how LogNorm works for the full loop from finding work to measuring it. If you want an AI teammate to draft the one-page templates and log results for you, read what a growth agent is and how it works with your team.
For a wider view of where experiments fit in your plan, our guide to growth marketing strategy covers choosing channels before you test inside them.
FAQ
How many growth experiments should a small team run?
Run as many as you can read cleanly, which for a team of one to three people is usually one new experiment a week at most. Each one needs an owner, a planned read date and a slot in the weekly review. Starting more than you can read produces a backlog of half-finished tests and no lessons.
Can you run A/B tests with low traffic?
Yes, but only for large expected effects. Run your numbers through a sample size calculator first. If the required sample would take months to collect, test a bolder change, use an upstream metric that happens more often, or switch to a before and after comparison over a long window and record the caveats.
How long should a growth experiment run?
Run it until the planned end date or sample size you set before launch, and no shorter unless it is causing harm. For page and onboarding tests, that is set by your sizing. For SEO and content experiments, read an early signal at 28 days and make the decision at 90 days, because new pages need time to be indexed and settle.
How do you prioritize SEO tasks into a growth backlog for a startup?
Put every SEO idea in one list, separate must-do fixes from bets, then rank the bets against each other with the same criteria, such as ICE or RICE. Ship the fixes as tasks without testing them. Turn the top-ranked bets into experiments with a prediction, a metric and a 28 and 90 day read, and feed each result back into how you score the next ideas.
What is the difference between a growth experiment and an A/B test?
An A/B test is one method for running a growth experiment. A growth experiment is the whole bet: the hypothesis, the metric, the stop rule and the decision. Many good experiments for small teams are not A/B tests at all, because their traffic is too low for a split test to give a clear answer.